Ethical Considerations for Using AI in Healthcare Software
Let’s keep it simple. In healthcare, trust, safety, and human dignity come first, no matter what solution you build. The same applies to AI. Today, it is everywhere, from clinics...
A well-established healthcare and life-sciences firm needed a smarter way to demonstrate the value of a newly developed diagnostic method for acute appendicitis.
Manual analysis wasn’t convincing enough, and it is not even scalable.
iFour Technolab helped them replace spreadsheets with an automated statistical analysis system that delivered instant, data-backed insights across regions and currencies.
Impacts Observed:
Faster analysis
Fewer Errors
Boosted speed
Higher adoption
Accuracy
The client is a recognized brand in the healthcare and life sciences ecosystem, offering sales, marketing, distribution, and executive management services.
They are known for data-driven decision-making and work closely with hospitals, physician offices, and research centres across Europe and Britain.
Industry: Healthcare
Geography: Europe & UK
Why They Came to Us:
Since accuracy and credibility are non-negotiable in everything they present to their clients, they wanted a custom solution that replaces spreadsheets with an automated statistical analysis system (for instant data-driven insights across regions & currencies).


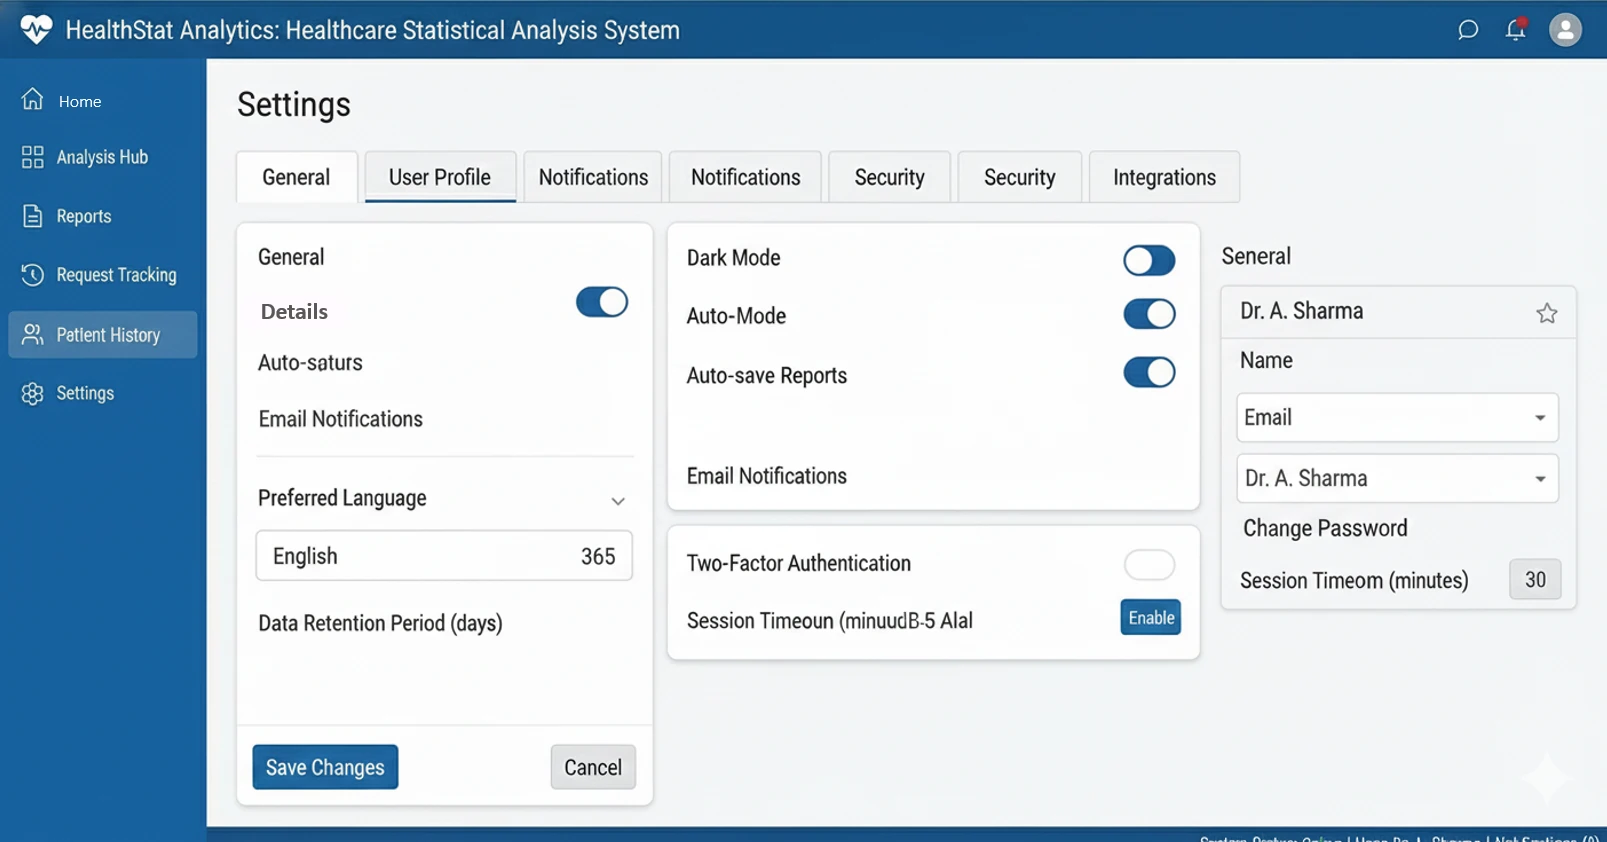
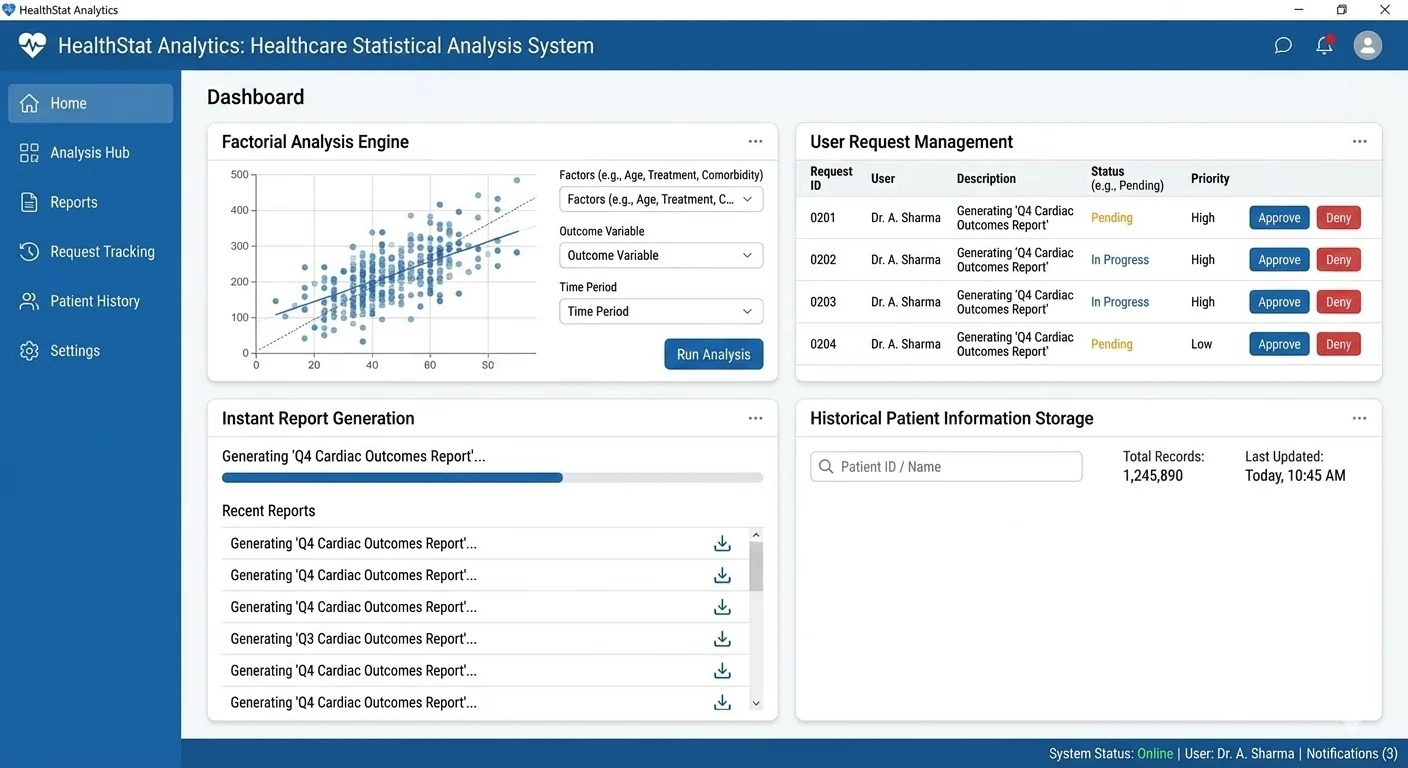
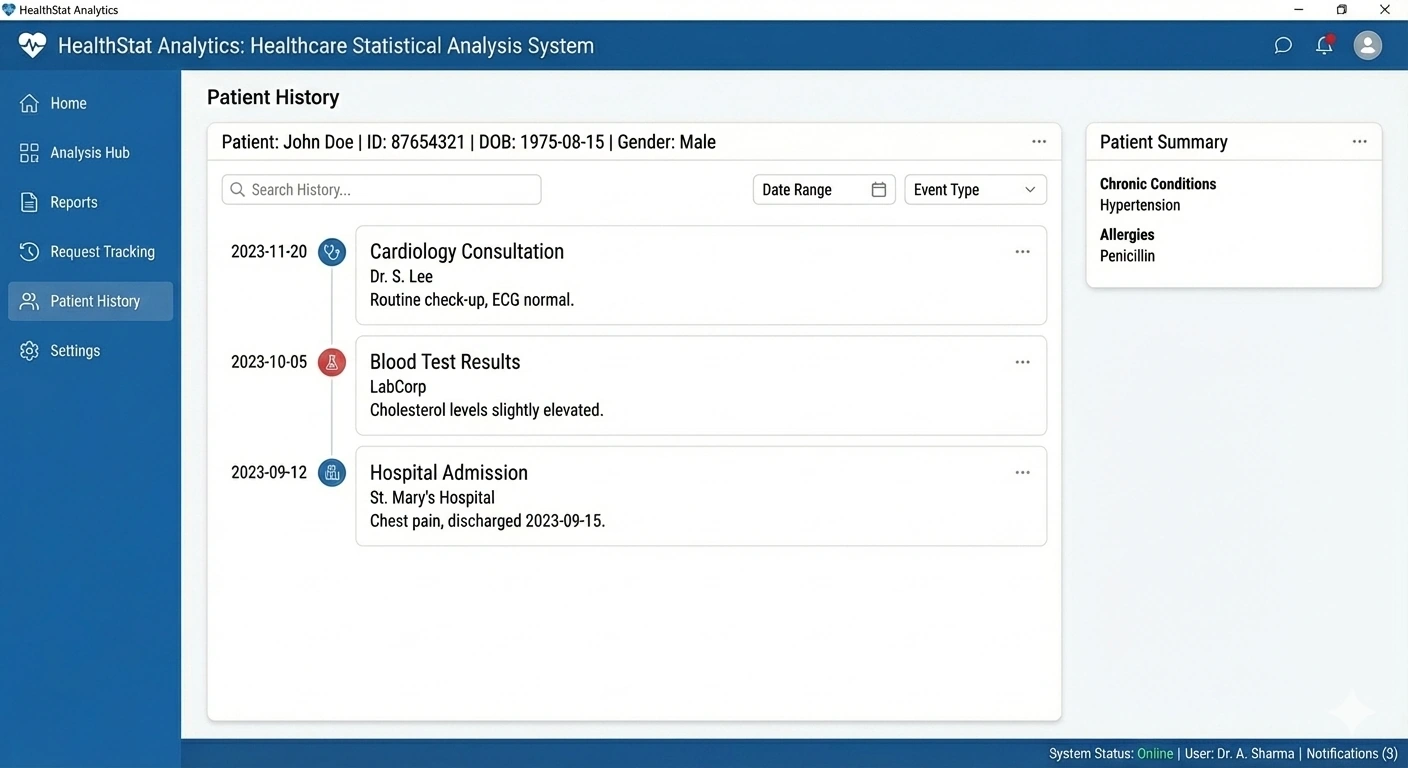
The client had developed a new, improved method for diagnosing and treating acute appendicitis. The science was strong - but the way it was being presented wasn’t.
They faced several challenges:
Cost-benefit analysis was performed manually, limiting speed and scalability
Difficulty demonstrating value across different regions and currencies
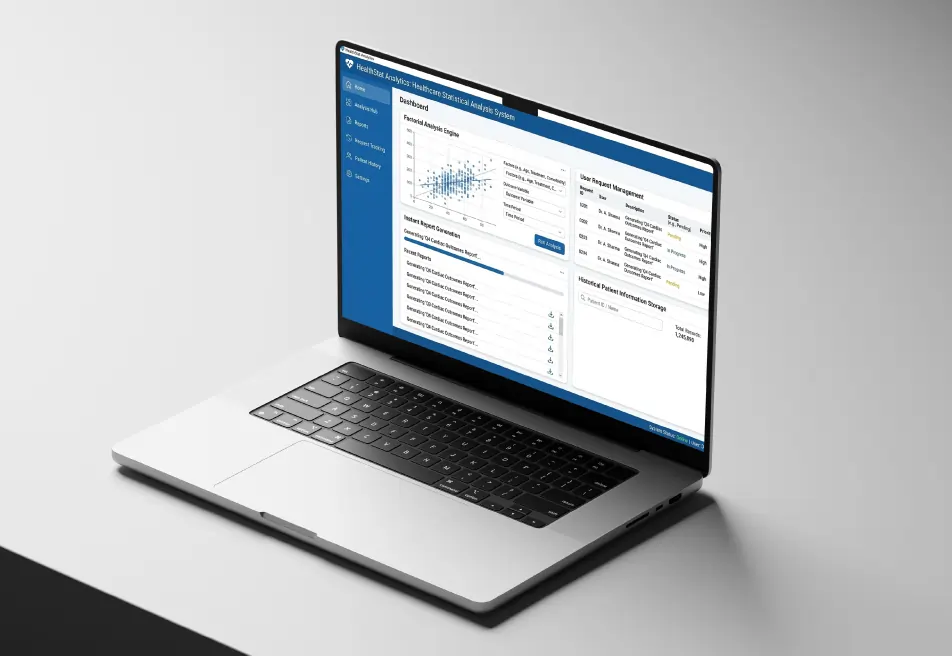
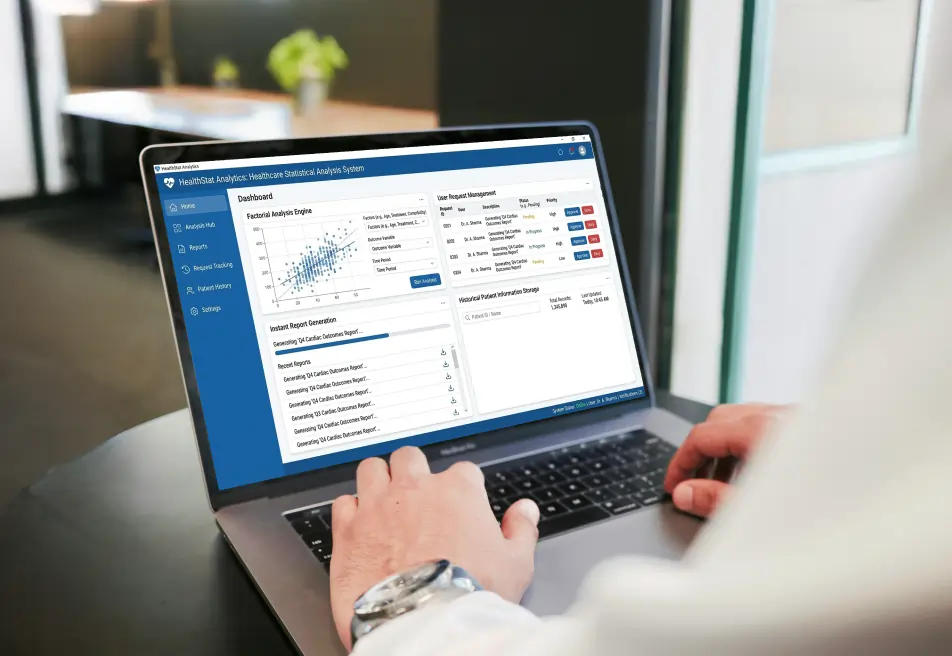
No automated way to handle factorial and predictive analysis
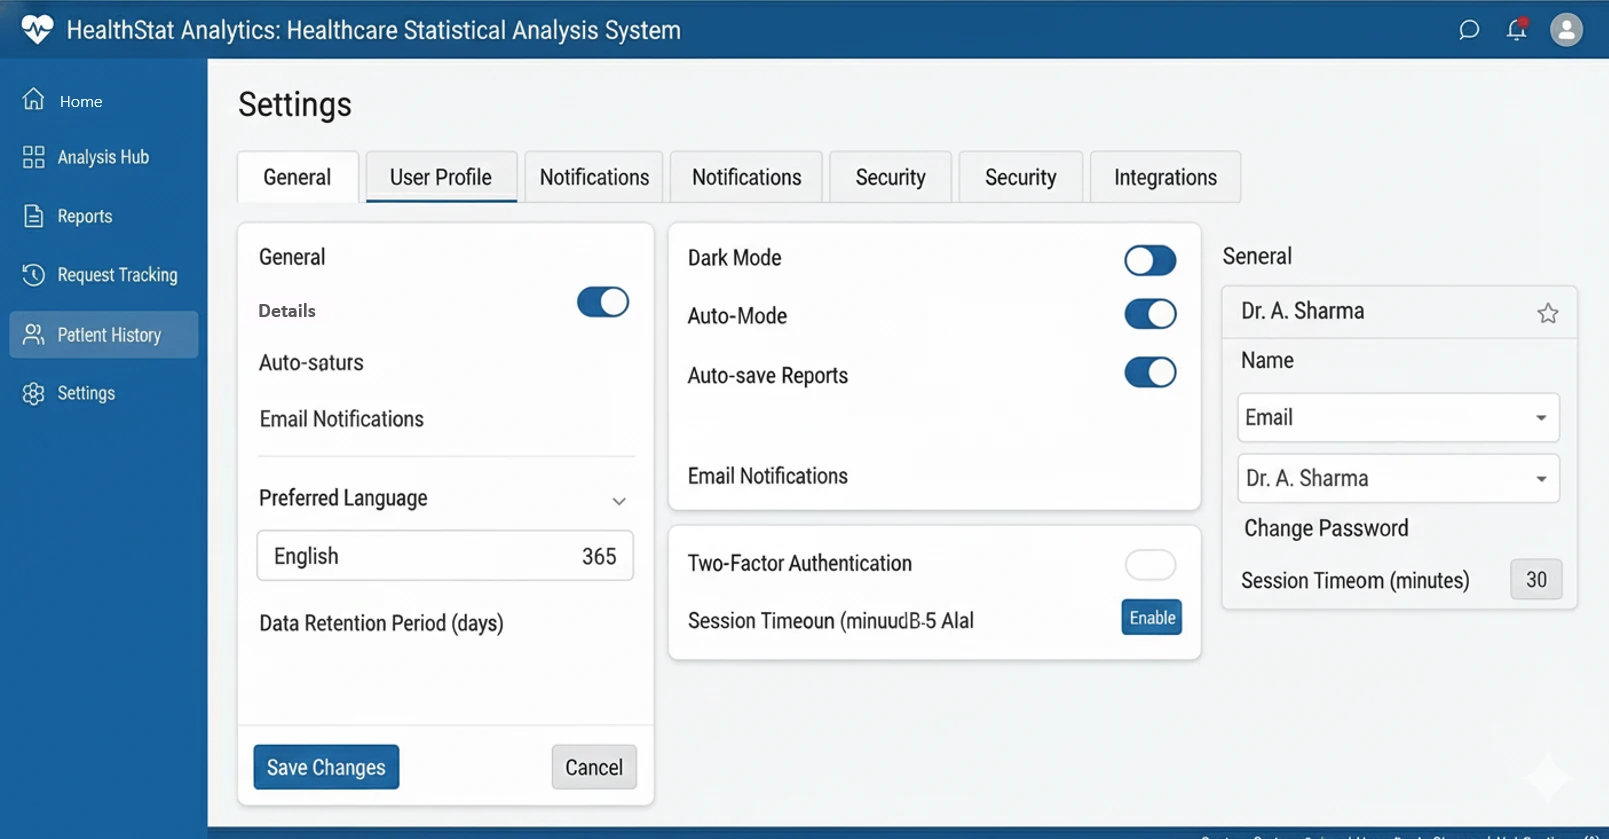
Limited ability to track user requests or reuse historical data
Need for instant, visually compelling reports to influence decision-makers
To drive adoption, they needed automation, precision, and clarity - without oversimplifying complex data.
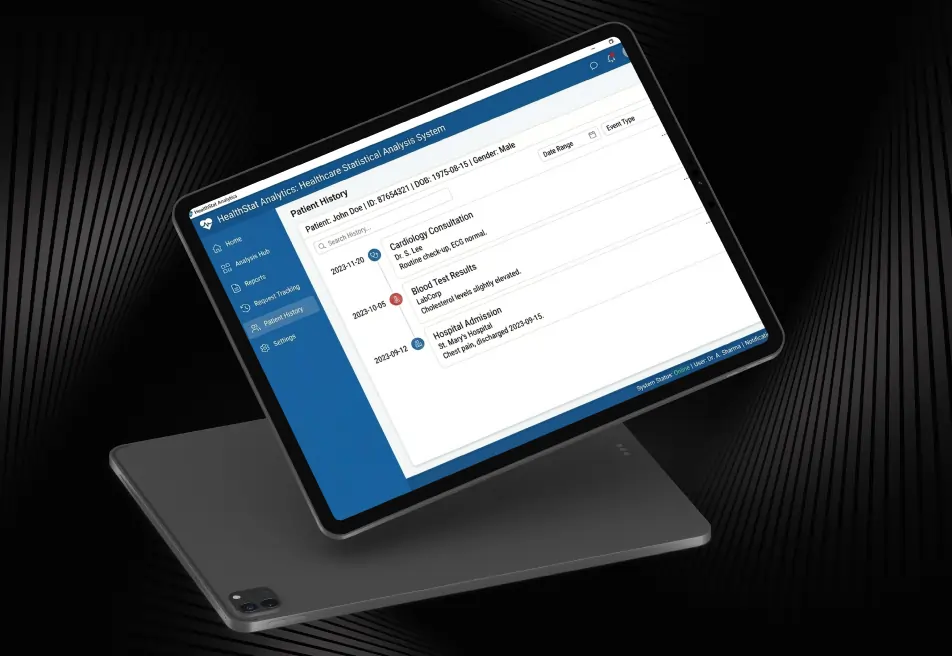
We built a web-based Healthcare Statistical Analysis System that automated cost-benefit modeling and transformed
how the client presented their new diagnostic method.

A single, automated platform that replaced manual analysis with fast, reliable, and persuasive insights.
Looking to expand your healthcare ecosystem with connected workflows and integrated data? Tap into our custom software development services.
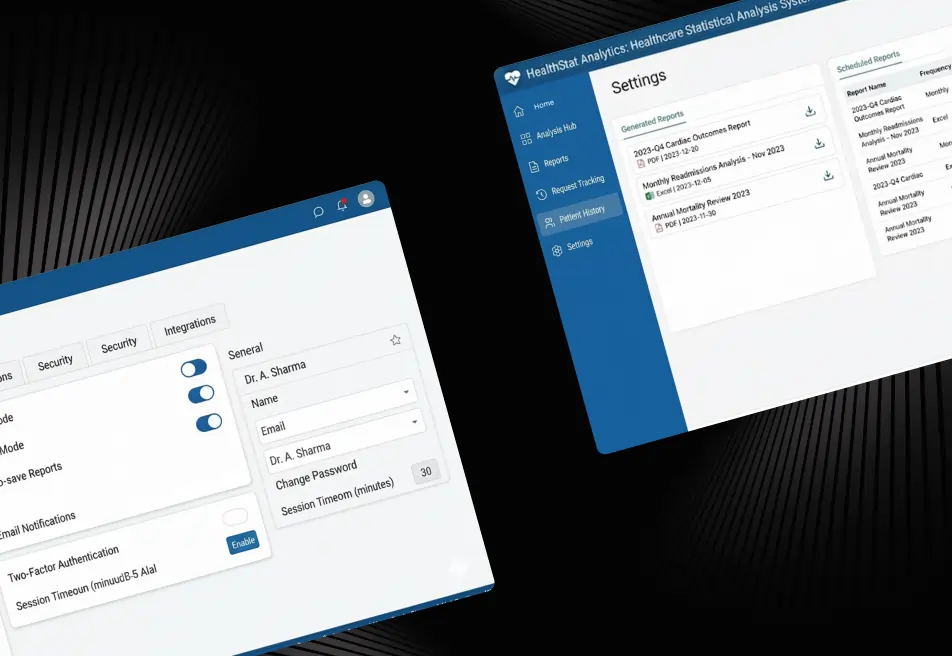
The system was built for performance, accuracy, and scalability.
This modular architecture allows future expansion as analytical models and business needs evolve.
The impact was immediate and measurable:
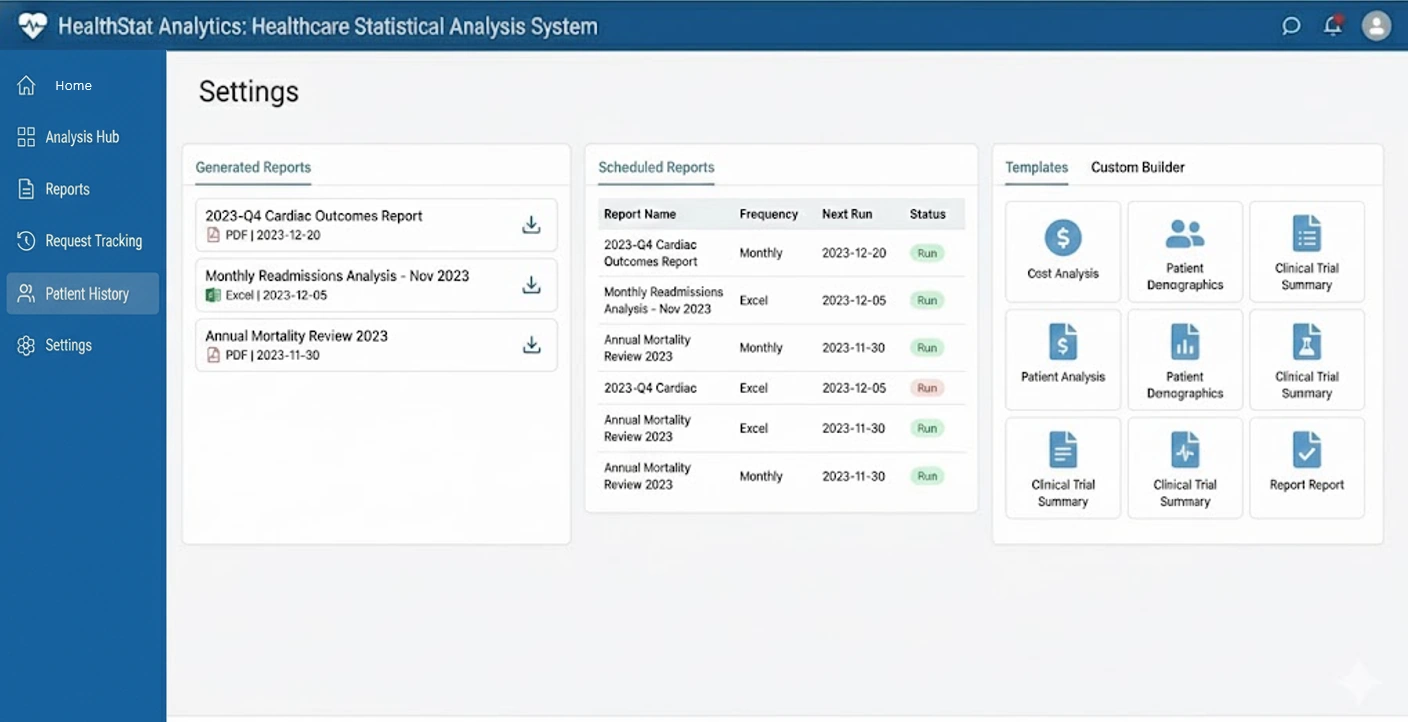
We helped a U.K based healthcare firm move from slow, manual calculations to smart, automated intelligence. The customer now makes evidence based decisions rather than just making assumptions.
Our sustainable automated solution now turns complex data from spreadsheets into simple, clear data for quicker actions.
Want to achieve the same digital transformation using AI and automated analytics? Explore our healthcare software development services to make it happen.


We encourage you to contact us with any questions or comments you may have.

See how we've transformed businesses with Azure cloud solutions
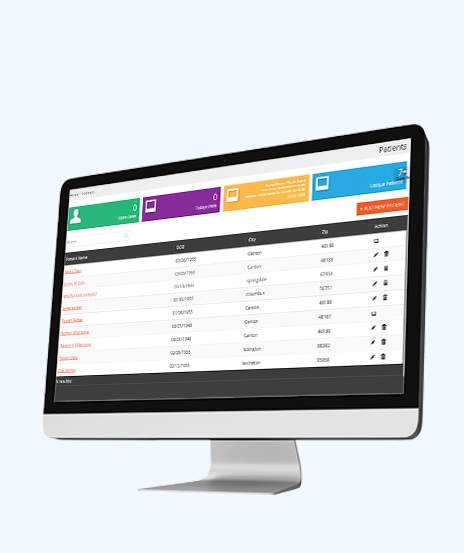
Quick Summary A leading US-based healthcare consultant needed a practical way to help their clients achieve HIPAA compliance - without disrupting day-to-day hospital operations. We partnered with them to build a centralized, secure ERP...

About Customer The customer is a well-established Dentist’s Association (i.e. Healthcare Association), offering a safe and high-quality digital environment for participants in healthcare chain to exchange administrative data for insurance...
Quick Summary A non-profit association supporting maternity care organizations across the Netherlands was struggling with fragmented and paper-heavy workflows - slowing things down. So, we built a custom and centralized web platform...
The customer is a Portugal-based IT consulting company founded in 1991 with the objective of offering specialized services in information technology systems in response to actual customer needs. It also focuses on offering technical training and certification...
challange Comprehensive healthcare checkup is critical for discovering internal threats to help individuals in escaping healthcare risks. The Healthcare client was looking for an autonomous and intelligent tracking system that could help their healthcare...

Quick Summary A well-established healthcare and life-sciences firm needed a smarter way to demonstrate the value of a newly developed diagnostic method for acute appendicitis. Manual analysis wasn’t convincing enough, and it is...
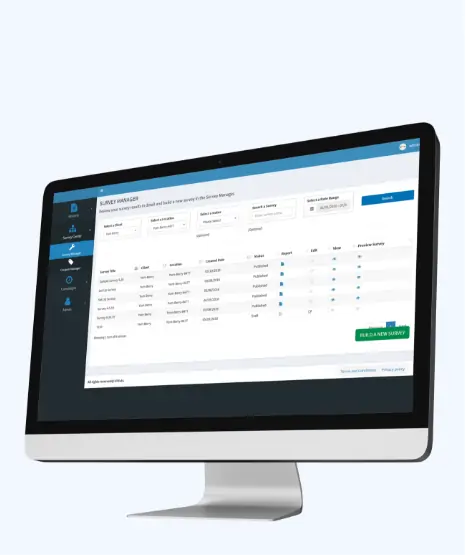
About Customer Customer is a leading e-Marketing firm based in USA. Customer primarily operates in the creation of an online medium by building sites and applications on mobile devices. Customer creates tailor-made softwares and focuses on...
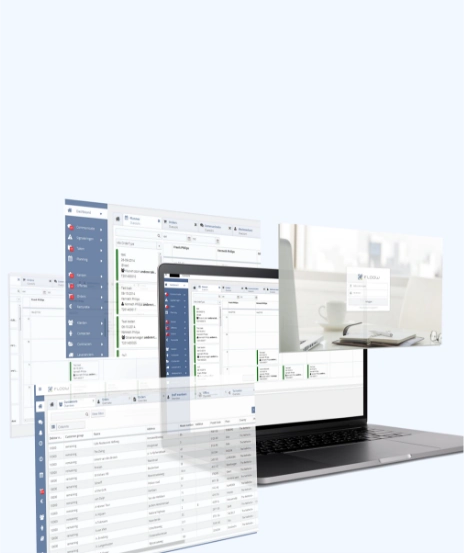
About Customer The client offers various software solutions that help the companies to strategize their business to elevate its relationship with their customers. They specialize in providing the best range of Point-Of-Sales systems along with...
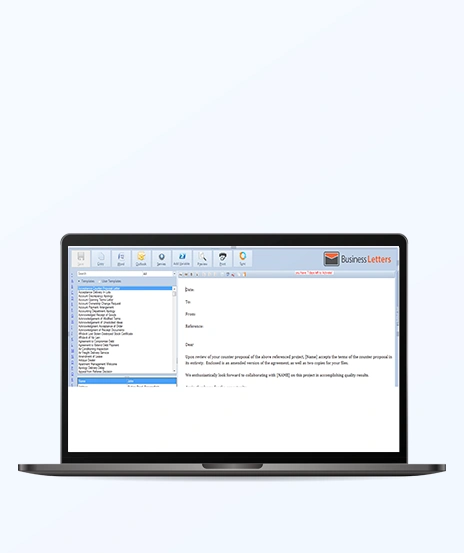
About Customer Customer is a global information service provider based in Melbourne, Australia. Customer specializes in providing productivity improvement products to SMBs (Small and Medium Businesses). Customer provides sustainable solutions...

About Customer Customer is an IT Professional working with Zealand's largest general insurance provider in New Zealand. He has wide range of experience working with SharePoint, Salesforce and other Microsoft technology stack. His diverse...
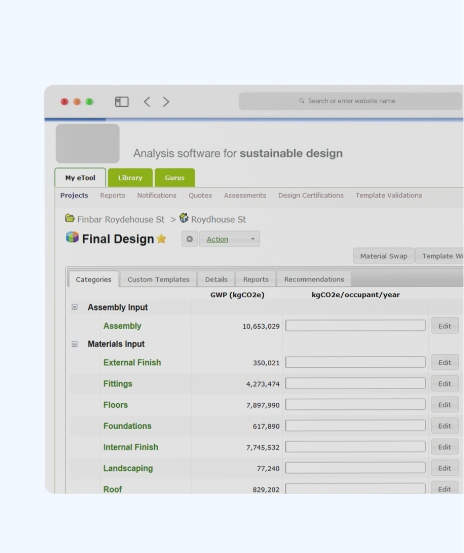
About Customer Customer is an Australia based firm that provides consultation on sustainable design of the buildings. Customer's orientation is to specialize in life cycle assessment of buildings and provide expert opinions and recommendations...
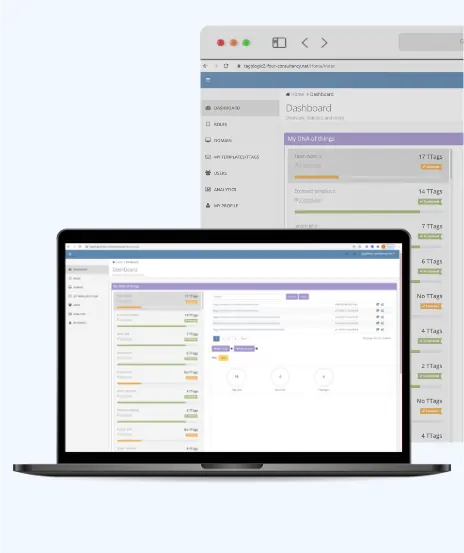
About Customer Customer is an innovator of model that uniquely identifies every physical and logical objects in the world. Customer is based in the Netherlands and has patented this model of uniquely identifying objects. Unique identifier specifies...

About Customer Customer is a leading software solution provider based in Georgia, USA. Customer is a website and graphic design specialist for business starters. Customer focuses on offering innovative marketing and branding strategies to its...

About Customer The customer is a leading business consulting firm in business process analysis, project management and software outsourcing. It needs a good project management software and wants to build an earned value management (EVM) software application...

About Customer Customer is a leading Gujarati media company in India engaged in Gujarati movies production, theatres and casting artists for various movies and projects. Customer has experience producing many prominent Gujarati movies and serials....
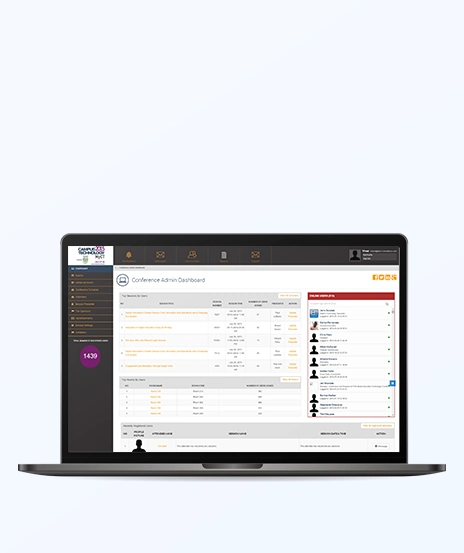
About Customer The customer is an application development company in United States that has focus to develop innovative and revolutionary applications for Event Management in education sector. Its mission is to provide users with web applications...
About Customer Customer is a leading training provider in Australia. Customer offers various computer programming or Microsoft training courses like MS Excel, MS Office, SQL, Xero, PHP, HTML, CSS, JavaScript, jQuery, and more. Customer is a preferred...
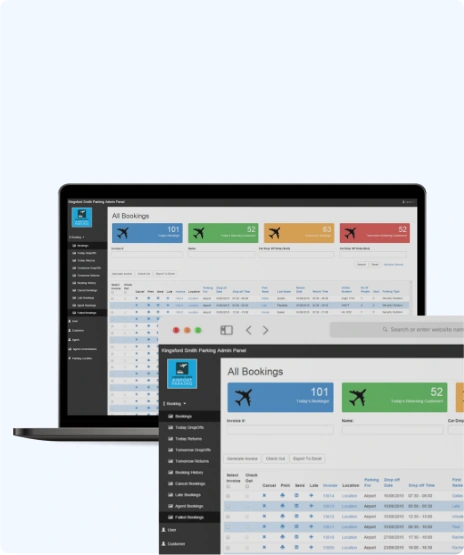
About Customer The customer is a leading airport parking operator in Australia. With the facilities ranging from undercover and outdoor parking facility to free shuttle services, a customer has been gaining faith and fame across the entire country....

About Customer Customer is an engineering consultant firm based in Australia. Customer’s core business is to provide services in real estate sector and property development industry. Customer designs sustainable engineering projects for...
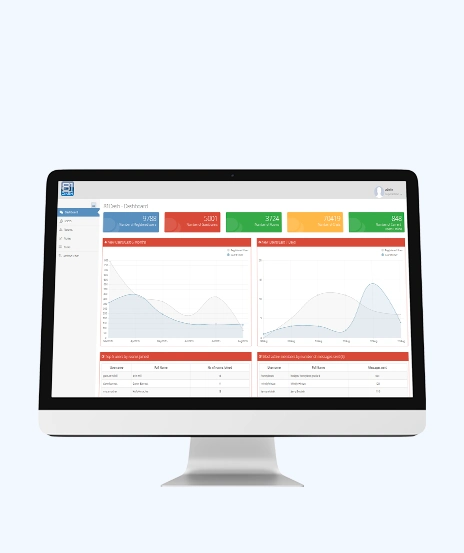
About Customer The customer is an application development company in United States that has focus to develop innovative and revolutionary applications in Education sector. Its mission is to provide users with web applications and sustainable...

About Customer The customer is an Application development company in Malta, Europe that is focused on developing innovative and revolutionary applications for Educational institutes. It is a leading end-to-end services provider aimed to provide clients...
About Customer The customer is an Australian company who helps business and policy makers to understand the overall impact of their activities and improve their sustainability performance. They have grown internally as well as they have strategic...
About Customer Customer is a leading debt management company based in Hamilton, USA. Customer offers financial services in marketing, buying, selling and brokering the portfolios. Customer provides cloud based and flexible debt exchange solutions...
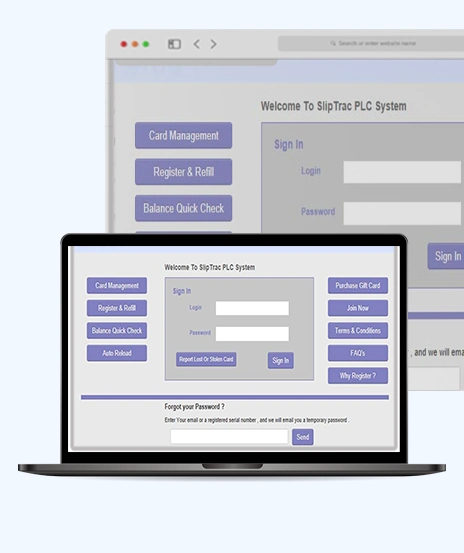
About Customer Customer is a leading service provider of state-of-the-art, highly integrated, transportation software solutions and administrative services in Canada and US. Customer also offers transportation booking features to third-parties...
About Customer Customer is a leading provider of highly integrated transportation software solutions and administrative services in Canada and USA. It has a vision to develop the quality products and dependable business relationships required...

About Customer Client is the prominent service provider in the Netherlands and abroad. It provides optimum services to its customers in Hospitality Industry. The client elevates the user experience by the use of a personalised software with rich...

About Customer The customer is a well-established Dentist’s Association (i.e. Healthcare Association), offering a safe and high-quality digital environment for participants in healthcare chain to exchange administrative data for insurance...

About Customer The customer is an organization in the Netherlands that provides care for the young and disabled. They address their complex care requirements such as disability, psychological problems and serious behavioral problems, with treatment,...

About Customer Customer is one of the prominent IT service providers situated in United States. Their maxim is to provide extraordinarily valuable and reliable IT services focused on various sectors such as disaster recovery, HR management,...
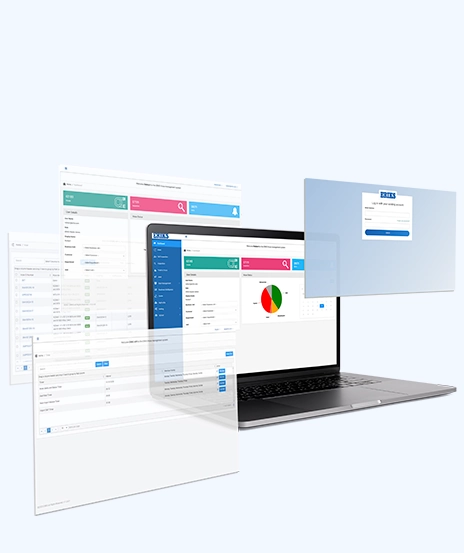
About Customer The customer is a leading international industrial service provider, a multi-product specialist offering a wide range of high-quality mechanical engineering components and associated technical and logistics services. Challenge The...

About Customer The customer is a leading consultant in the real estate domain situated in the Netherlands. They maintain a platform that provides information links to physical objects such as buildings and products. The platform ensures that this information...

About Customer The customer is a leading consultant in the real estate infrastructure domain situated in the Netherlands. Along with other service providers, they construct and operate buildings and structures for their customers. They connect group...
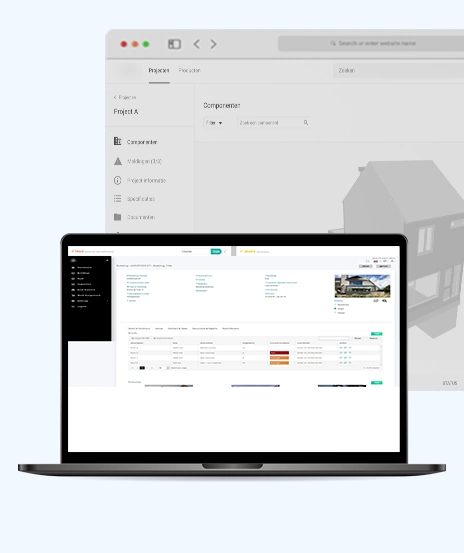
About Customer The customer is the leading consultant in the real estate domain. They offer maintenance contract that includes an annual inspection, cleaning roofs and small damage repairs. Customer works for professional building managers of...

About Customer Customer is a leading industrial equipment manufacturer in Saudi Arabia and United Arab Emirates. Customer is working in all sectors such as oil and gas, petrochemical, Aluminum and steel manufacturing, Power and water utilities...

About Customer The customer is a well-known family clothes retailer based in California, USA. It sells stylish and casual lifestyle products made just for Ranchers. It primarily focuses on apparel, footwear, accessories, and home decors for professionals,...
About Customer Customer is a leading consultant in United States that has a focus to bring about an innovative online platform that provides a place for hang out with different people. It is achieving a huge potential of growth and prosperity...

The customer is from the United States and sells used books on the Amazon e-Commerce platform. It primarily focuses on providing quality services at reasonable prices with the latest supply chain methods. It has improved its selling operations and made...
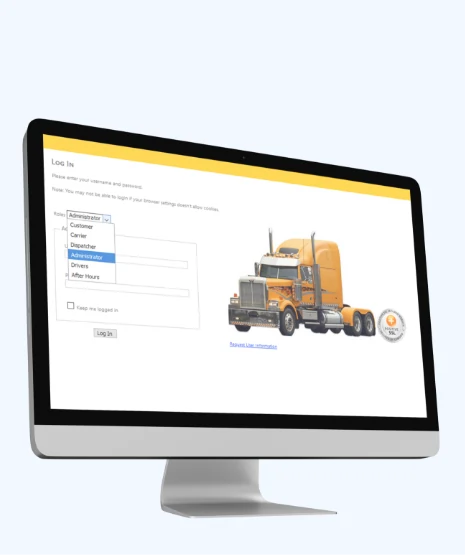
About Customer Customer is one of the foremost transportation and shipping service providers in United States. It largely emphasizes on delivering finest services at minimal possible freight shipping rate. Customer's extensive network in...
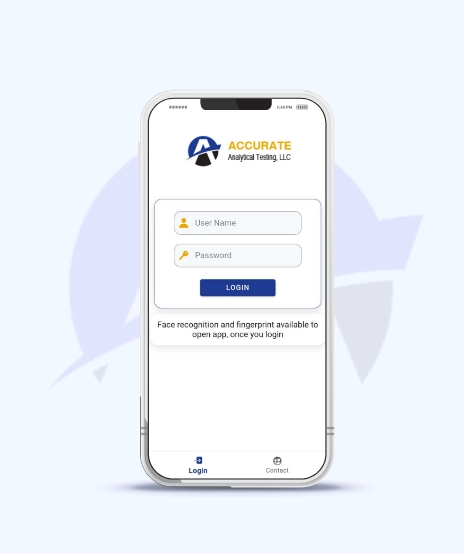
About Customer Our customer is a reliable software development company in USA with branches in Greater Detroit and in Indianapolis area. It offers full spectrum of IT consulting services to its clients and help them achieve their business goals. challange The...
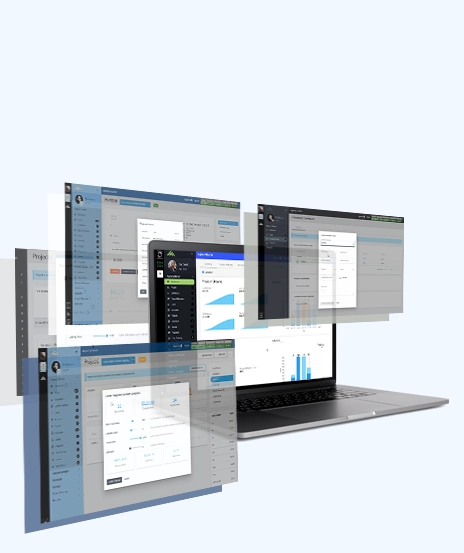
Running a freelance business is more than just being a contractor with an LLC. To build a sustainable business, you need to recruit talent, establish marketing channels, build a sales pipeline, manage accounts, dispatch work orders, send proposals, manage...
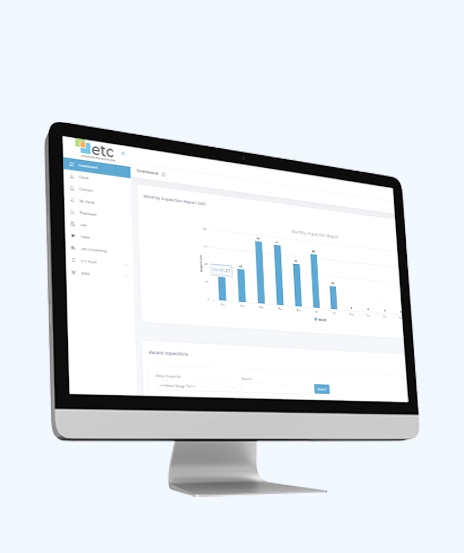
About Customer Our customer is a reliable software development company in USA with branches in Greater Detroit and in Indianapolis area. It offers full spectrum of IT consulting services to its clients and help them achieve their business goals. challange Many...
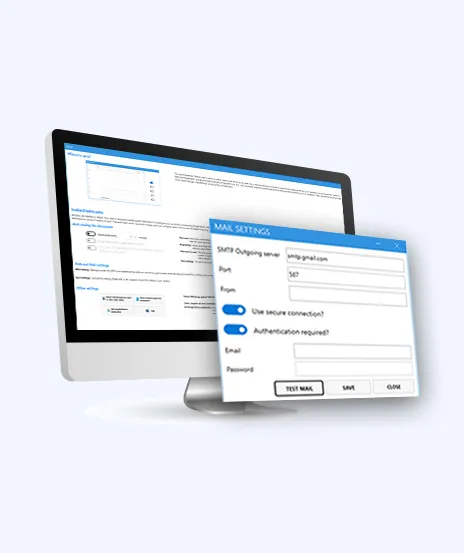
While using Office Apps (Word, PowerPoint and Excel), you can save your file in one place at a time. However, you could possibly face data loss if uncertainties such as system crash, hard drive failure, etc. occur. Hence, you have to maintain proper backups...
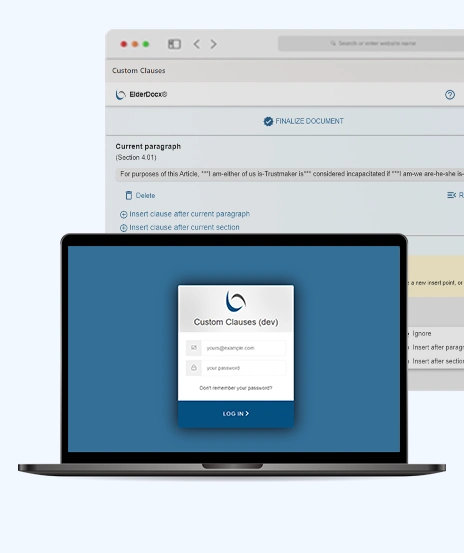
A feasible record management tool is what every lawyer would like to have to manage their work. As it is difficult to maintain and manage non-digital files of large number of customers, an efficient solution to add clauses, offer documentation and handle...
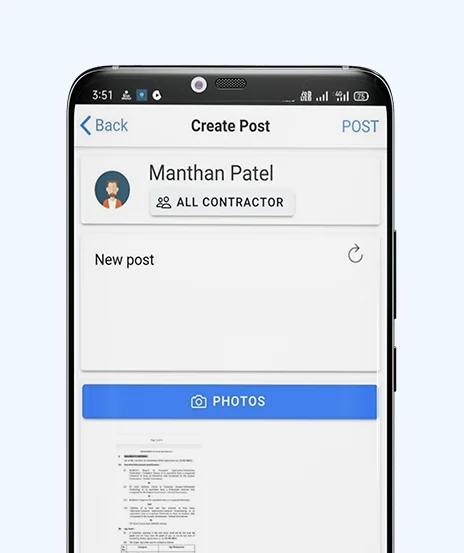
Sometimes contractors face difficulty in finding workers in their area to complete jobs on time. The client was seeking to build a solution where contractors can post their job requirements easily and find workers effortlessly. iFour Technolab has helped...
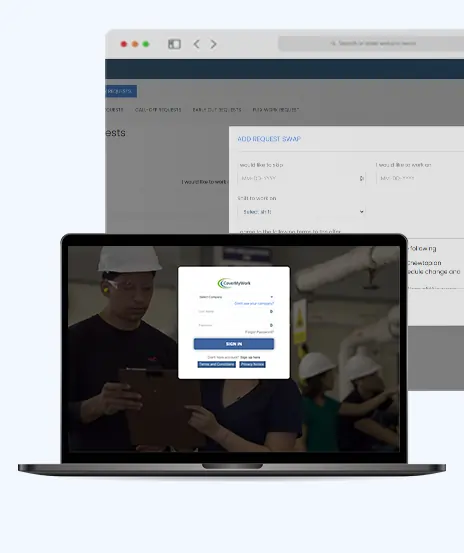
In any organization, it is difficult for managers to create and manage schedules, given people’s preferences and availability, especially while working in shifts. This problem gets exacerbated when faced with shift swap requests, sick calls, no-shows,...

About Customer The customer is a US-based leading coaching institute. It would like to offer a tool to its students through which they can track the projects assigned to them. Challange The customer realized the need for a robust and resilient...
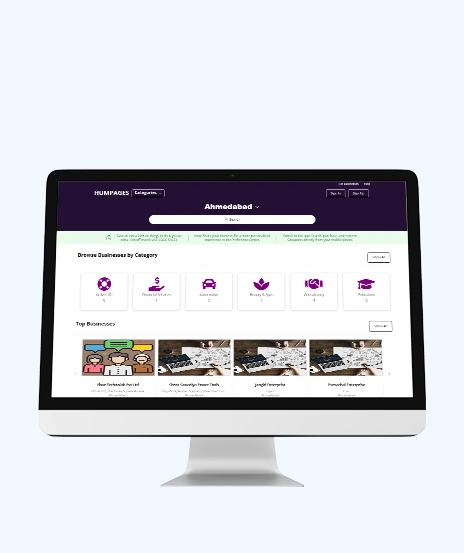
The goal was to make it simple for customers to find various businesses around them and take advantage of unique offers in areas including restaurants, spas, salons, and more. Another challenge was offering online event administration resources, such...
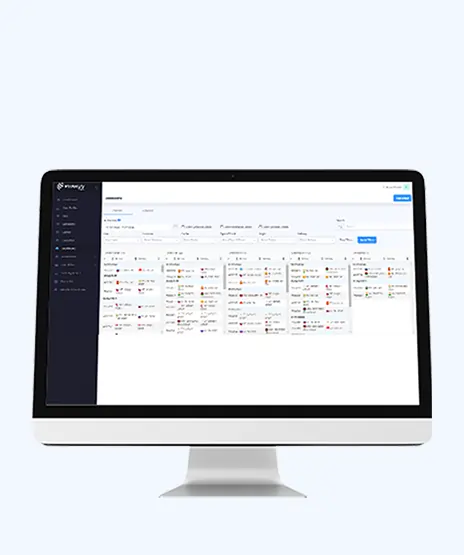
challange Performing tasks manually imposed many limitations such as real-time communication, inability to manage logistics, calculate shortest paths, forecast weather, and insecure payment methods. To eliminate such concerns and manage transportation...
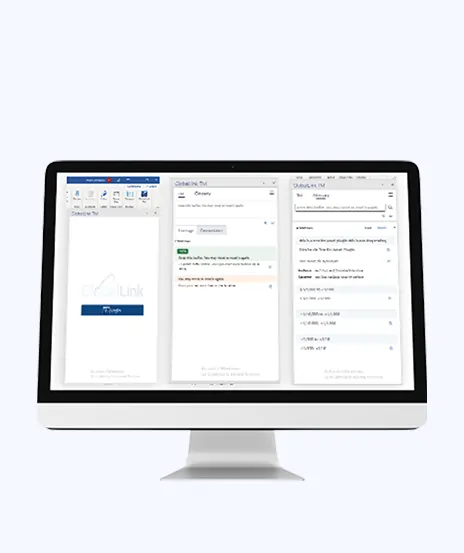
challange The customer desired a system that could fetch matching data (both partially and accurately) to assist users in simplifying their activities. They sought for an integrated solution that could leverage the translation API to retrieve user...
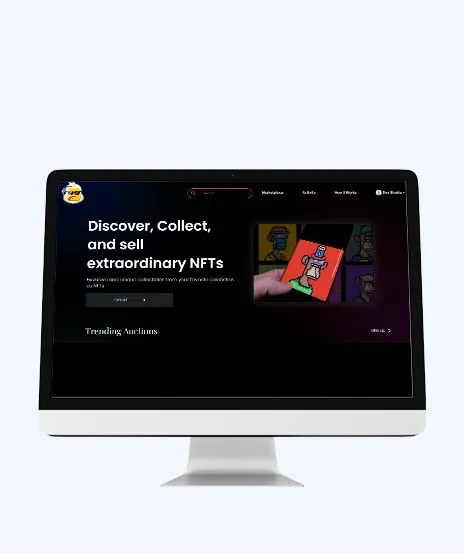
Challange The customer was looking for a one-stop solution where he could easily collect and sell unique NFTs. He wanted to establish a marketplace where the list of collectibles might be shown. He also planned to include a function that would allow...
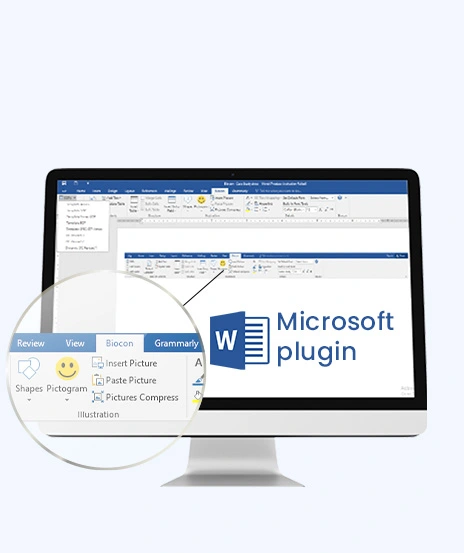
challange When working with Microsoft Word, you may often need to employ resources such as data tables, templates, emoticons, and so on. Rather than using built-in resources, the client sought to create a bespoke plug-in that could offer a variety...
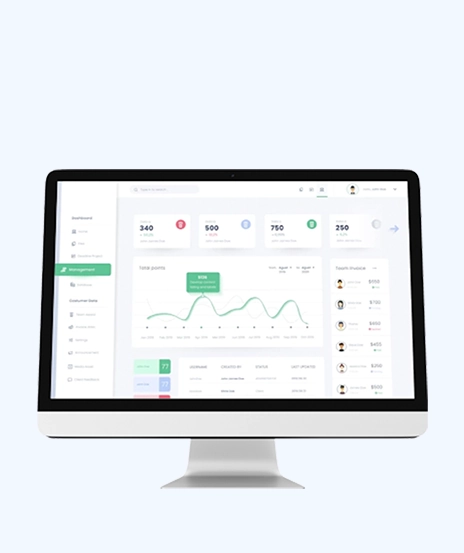
About Customer The client is a US-based firm that provides exceptional software to aid industries in monitoring competitors, their services, and products. It helped various clients build concrete business strategies by understanding competitors'...
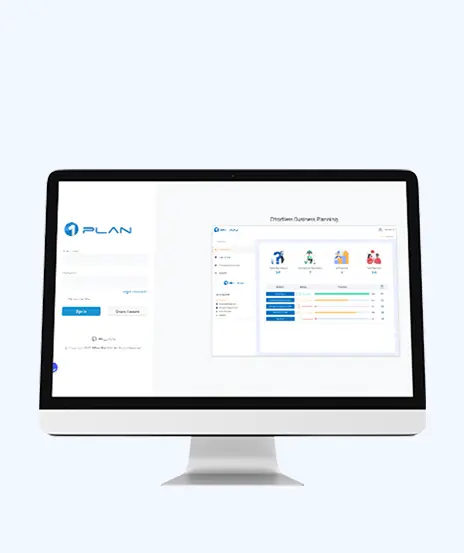
About Customer The customer is an Australian-based organization that provides substantial tools and advice to startups and mid-sized enterprises in order to help them expand their businesses. The firm has passionate individuals who are experts in resolving...

Quick Summary UR Protection Security, a Brisbane-based agency, faced significant inefficiencies due to manual scheduling, reporting delays, and limited real-time oversight. iFour stepped in with SafeIngress, a centralized, AI-enhanced web...
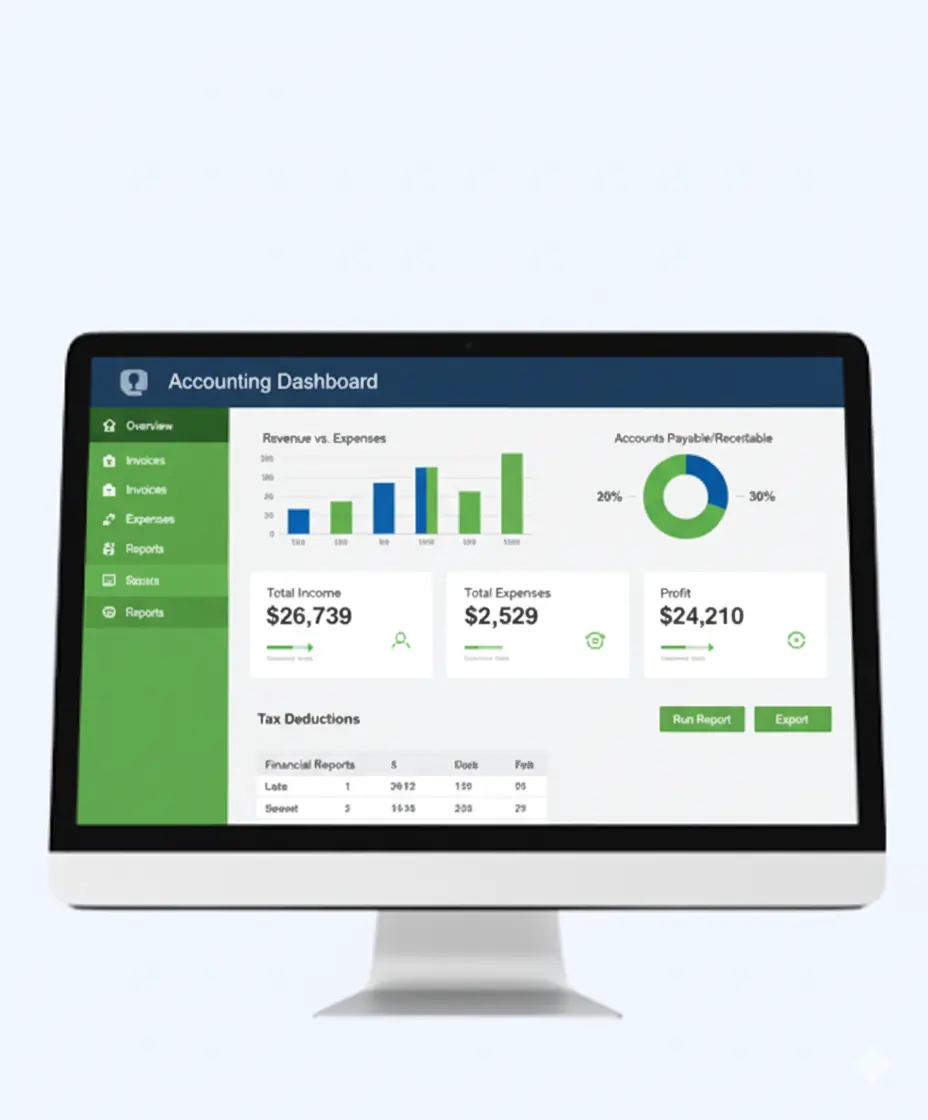
Quick Summary In Australia, payroll typically starts with gross pay and deducts to get net pay. But for small businesses, reverse-calculating gross from net can be challenging. This case study shows how a new reverse payroll system developed...
Quick Summary Independent landlords in the U.S. were losing money and visibility to big rental platforms that charged heavy listing fees. Renters, on the other hand, struggled with slow, complex search experiences. This case study shows...
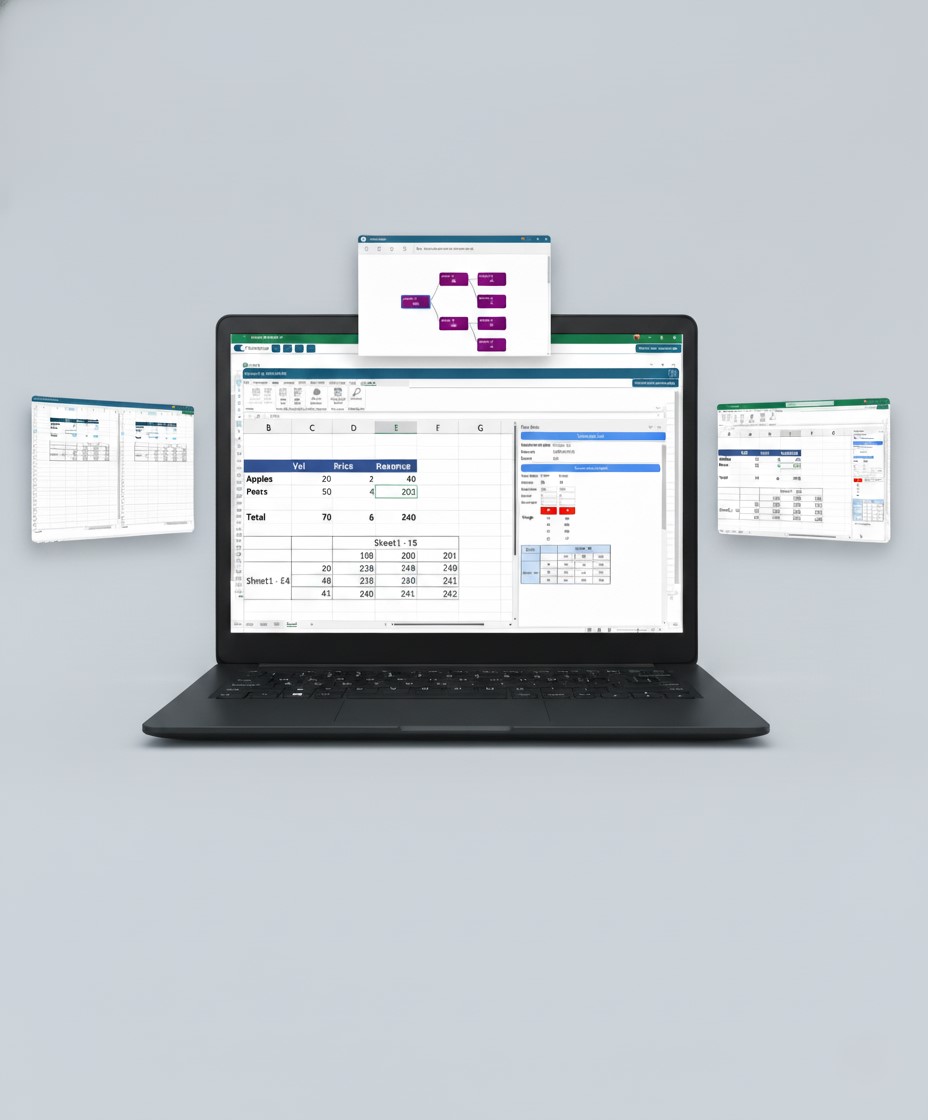
Quick Summary Manual Excel tracking was the main problem for a US-based consulting company due to the operations heavily relying on high-stakes analysis and data-driven decisions. This was slowing teams down and creating unnecessary risks. iFour...
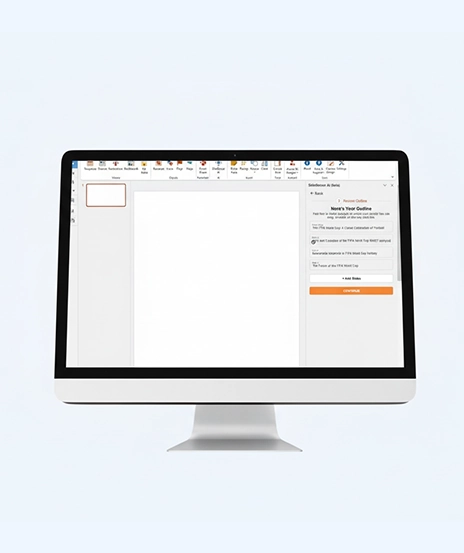
Quick Summary A well-known global presentation consulting firm had a huge collection of high-quality PowerPoint templates and design assets. But they faced a major challenge in organizing, accessing, and monetizing them efficiently. iFour...
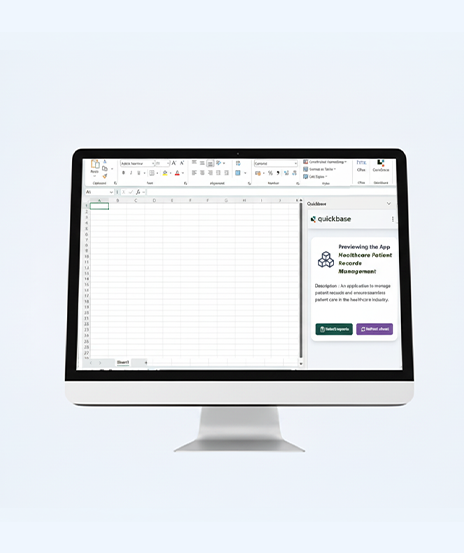
Quick Summary Many U.S. businesses face a common challenge: data being stuck in core systems, making analysis slow and frustrating. Exporting and matching versions takes time and often causes mistakes. This case study shows how iFour...
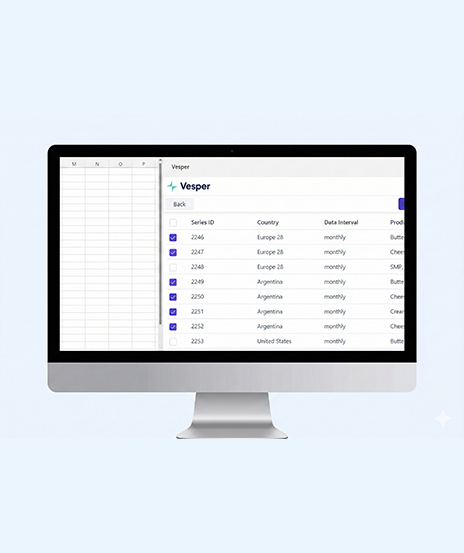
Quick Summary A leading commodity intelligence sector noticed something surprising: users were still copying data manually from dashboards into Excel for analysis. Despite having advanced tools, Excel remained their comfort zone. To...

Let’s keep it simple. In healthcare, trust, safety, and human dignity come first, no matter what solution you build. The same applies to AI. Today, it is everywhere, from clinics...

Let's keep it real. The whole point of building autonomous Agents is to cut manual work and keep focus on business. Approvals that used to take days can happen in hours because...
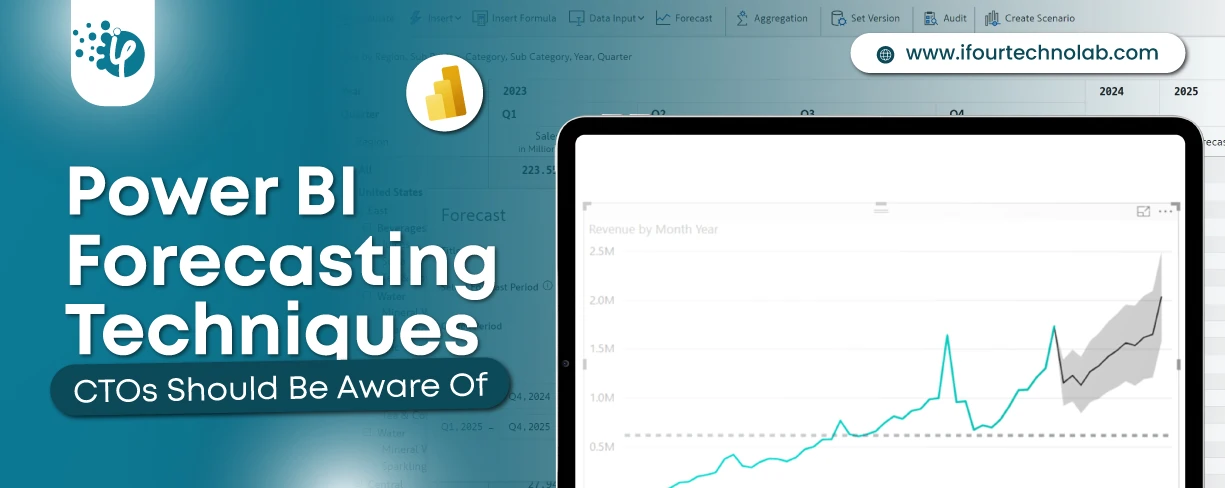
Remember our last guide - Power BI forecasting? It revealed things that truly blocks accuracy, both structural and situational. Now it's time to take the next step. Knowing Power...