×

iFour Logo

PowerApps development vs Power BI development: What's the difference

Kapil Panchal - November 23, 2023

Listening is fun too.

Straighten your back and cherish with coffee - PLAY !
  • play
  • pause
  • pause
PowerApps development vs Power BI development: What's the difference

Microsoft has been outstanding in providing platforms and services successfully making a significant impact in the market. Among them, Power BI and Power Apps development services have been the customer favorites.

Did you know - that around 49.13% of organizations in the United States use Microsoft PowerBI, while 6356 global enterprises have begun utilizing Microsoft Power Apps for their bespoke application development, as of 2023? That’s how these tools are making their moves in the advanced world.

Now, let's go over the differences between PowerBI and PowerApp custom development platforms in further detail. Let's begin with the fundamentals.

What is Microsoft Power Apps?


Microsoft PowerApps is a leading low-code development platform used for building custom apps for various domains. What makes it different from other platforms is the ability to create bespoke applications without dealing with complicated code. Its user-friendly layout with easy selections makes it a popular choice for multinational enterprises.

So, whether you're a tech whiz or just getting started with all things digital, PowerApps is there to help you make apps without any concerns.

Why Microsoft PowerApps development?


Imagine you've got an awesome idea for an app that makes work a bit smoother. But as a non-tech individual coding is not your cup of tea. Now with the help of Microsoft PowerApps, you can simply create your custom app with drag-and-drop functionality without any code requirement. This is the best part of Microsoft Power Platform, making it a whole vibe for super easiness. You drag things around, drop things where they make sense, connect the dots, and there you are!

No more extra expenses or wasting time in coding and fixing. Just go digital in no time. You can build any kind of app be it for tracking flows or managing customer requests. It’s the best platform for making custom solutions in minimal time.

Turn your ideas into reality with a reliable .NET development company

What is Microsoft Power BI?


Microsoft Power BI is a super-smart tool that helps organizations manage their business data easily and effectively. It is a fact that as the business grows so does the data. And that’s where Power BI comes into play. No matter how big your data is (be it structured or unstructured), Power BI manages it effortlessly.

It is a boon for businesses that depend on digital data generated from different departments like Sales, inventories, customer feedback, etc.

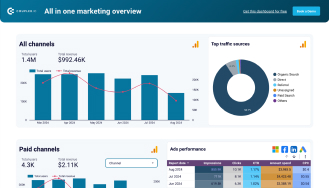
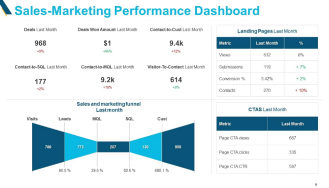
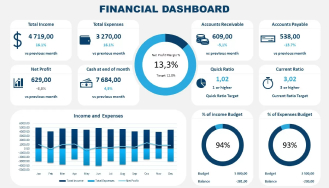
So, what does Power BI do? It collects all your scattered data and turns it into easy-to-understand charts and graphs. It's like magic – transforming confusing numbers into colorful pictures that tell a clear story.

With the help of these graphs and charts, employers can see trends, patterns, and other essential insights. This is like revealing the strengths and weaknesses of your business and rectifying issues.

What’s the role of Microsoft Power BI in the business?


Microsoft Power BI plays a crucial role in businesses by helping them make sense of their data. It helps you when you have large amounts of business data scattered from segments such as Delivery, customer portals, feedback, sales, etc. It gathers data from different sources and organizes it perfectly in the form of charts and graphs to help you make informed decisions.

For example, if you have a general store, Power BI can show you graphically which products are flying off the shelves and which ones need a little boost.

The best part of Power BI is that it lets you share these insights with your team so that everyone can be in the same lane. Everyone can learn what's really going on and what’s not.

So, what are you waiting for? Make your business smarter and digital with Power BI development services.

Is Power BI the same as Excel?


Although both Excel and Power BI are used for data analysis, their capabilities differ. The following are the critical differences:

  • Microsoft Excel can only manage a limited amount of data, but Power BI can handle massive amounts of data.
  • Power BI can connect to a wide variety of data sources, but Excel has restricted connection capabilities.
  • More importantly, Power BI is easy to use from mobile devices, whereas MS Excel is tough.

Is coding required for Power BI?


Power BI does not require any code. Instead, it employs formula languages such as DAX (Data Analysis Expressions) and M. What’s more interesting about this impeccable platform is that it does not let you depend on coding language options, rather its scope of capabilities is enough for data transformation, modeling, and visualization.

Wave goodbye to tedious tasks with Microsoft 365 development services.

Power App development process: A brief overview


Now that you have an idea about what Power Apps is and how crucial it is for low-code application development. Let's understand about Power App development process in simple steps:

Step 1: Define Your Purpose

  • What do you want your app to do? First, define your core purpose. What challenges will your solution solve or streamline?

Step 2: Plan Your App

  • Sketch it out: Before getting into the technical stuff, prepare an outline or rough sketch about your app design, look, features, and functions. In addition, do consider its look in different screens.

Step 3: Set Up Your Power App Environment

Step 4: Choose a Design Template

  • What’s best about Power Apps is that it offers hundreds of design templates. Check them out, and pick the one that suits your app's purpose. You may also start with a blank canvas to custom-design it from scratch.

Step 5: Build Your App

  • Drag and drop: Make use of the Power App builder which allows you to drag and drop different elements onto your canvas. Connect these elements and develop functionalities that you envisioned in the planning stage.

Step 6: Define Data Sources

  • Where's your data coming from? Integrate your app with data sources like Microsoft Excel, SharePoint, or other databases to ensure your app has the information it needs.

Step 7: Add Logic and Functionality

  • Make it work: Use Power Automate to add logic and automate processes within your app. For example, you can set up approval workflows or notifications.

Step 8: Test Your App

  • Before you launch your application, make sure you test it properly and effectively. Consider if all the added features work as per expectation. Does all the data flow correctly? And so on.

Step 9: Get Feedback

  • Ask for opinions: Share your business app with a small group of users be it colleagues, friends, etc. Gather feedback and make any necessary adjustments.

Step 10: Deploy Your App

  • Go live: When you feel your application is ready for live, deploy it and distribute it to your target audience. Gather feedback (consider both positives and negatives), and then work on critical improvements.

Step 11: Monitor and Update

  • Keep an eye on things:Regularly check how your app is performing. As user feedback and ratings play a critical role, make improvements based on them.

By following these steps, you can navigate the Power App development process in a clear and organized manner.

Enhance your business efficiency with an eminent Office Add-in development company

Phases of Power BI development


Now that you have a clear idea about what Power BI is and how well it gathers and scatters data of all types (be it from sales, customer service, and other areas) and turns them into colorful pictures, charts, and graphs to show a clear story. Let us now understand the phases of Power BI development.

Given below are the different phases of Power BI development:

Phase 1: Planning

Begin by identifying your requirements. For example, what type of insights you are looking for? Specific requirements (if any) for reporting and analytics. Outline the objectives you wanna achieve.

Phase 2: Data Preparation

Collect relevant data from various sources, like Excel files, online services, databases, etc. Now use Power Query in Power BI to transform this raw data into a usable format. Cleanse, filter, and shape the data to fit your reporting needs.

Phase 3: Model Building

To do this, create a data model and define relationships between distinct tables. This phase is essential for Power BI to understand how data is linked and to do appropriate analysis.

Next, Use Data Analysis Expressions (DAX) to create calculations and measures that provide valuable insights. This could include creating custom metrics or aggregating data in specific ways.

Phase 4: Report and Dashboard Creation

Use the Power BI Report Builder to create interactive reports. Select visualizations that effectively depict your data, such as charts, tables, and maps.

Create dynamic dashboards by combining various reports. Dashboards provide you with a high-level summary and allow you to delve down into specifics.

Phase 5: Reports Deployment

Deploy your Power BI reports and dashboards to the Power BI service. Share them with your team to access the real-time data.

Phase 6: Usage Monitoring and Optimization

Keep track of user interaction with your reports and dashboards and monitor their behavior to learn which visualizations are most valuable. Accordingly, make adjustments. To optimize Power BI performance, make sure you -

  • Refine data models
  • Optimize report loading speed and
  • Improve user experience

Phase 7: Training and Support

Provide user training and continuous assistance for questions and upgrades to suit changing company needs. This is a critical stage in maximizing the benefits of the designed solution.

These are the critical phases you may systematically develop and implement as a Power BI solution and meet your data reporting needs in your organization.

PowerApps vs Power BI: Conclusion


Power BI and Power Apps development have become buzzwords these days. And why not, after all, they have some amazing features that make development and analysis so simple and effective.

Microsoft PowerApps is a popular low-code development tool for creating bespoke applications across several domains. Microsoft Power BI, on the other hand, is a super-smart application that helps firms manage their corporate data effortlessly and effectively.

This blog has gone through the basics and differences between PowerBI and Power App development platforms in detail. We've also discussed how important they are in today's business context, the PowerApp custom development process, and the Power BI phases. Hope you have understood the essentials of these two leading platforms. For more informative posts, visit our blog section.

PowerApps development vs Power BI development: What's the difference Microsoft has been outstanding in providing platforms and services successfully making a significant impact in the market. Among them, Power BI and Power Apps development services have been the customer favorites. Did you know - that around 49.13% of organizations in the United States use Microsoft PowerBI, while 6356 global enterprises have begun utilizing Microsoft Power Apps for their bespoke application development, as of 2023? That’s how these tools are making their moves in the advanced world. Now, let's go over the differences between PowerBI and PowerApp custom development platforms in further detail. Let's begin with the fundamentals. What is Microsoft Power Apps? Microsoft PowerApps is a leading low-code development platform used for building custom apps for various domains. What makes it different from other platforms is the ability to create bespoke applications without dealing with complicated code. Its user-friendly layout with easy selections makes it a popular choice for multinational enterprises. So, whether you're a tech whiz or just getting started with all things digital, PowerApps is there to help you make apps without any concerns. Why Microsoft PowerApps development? Imagine you've got an awesome idea for an app that makes work a bit smoother. But as a non-tech individual coding is not your cup of tea. Now with the help of Microsoft PowerApps, you can simply create your custom app with drag-and-drop functionality without any code requirement. This is the best part of Microsoft Power Platform, making it a whole vibe for super easiness. You drag things around, drop things where they make sense, connect the dots, and there you are! No more extra expenses or wasting time in coding and fixing. Just go digital in no time. You can build any kind of app be it for tracking flows or managing customer requests. It’s the best platform for making custom solutions in minimal time. Turn your ideas into reality with a reliable .NET development company Contact us now What is Microsoft Power BI? Microsoft Power BI is a super-smart tool that helps organizations manage their business data easily and effectively. It is a fact that as the business grows so does the data. And that’s where Power BI comes into play. No matter how big your data is (be it structured or unstructured), Power BI manages it effortlessly. It is a boon for businesses that depend on digital data generated from different departments like Sales, inventories, customer feedback, etc. So, what does Power BI do? It collects all your scattered data and turns it into easy-to-understand charts and graphs. It's like magic – transforming confusing numbers into colorful pictures that tell a clear story. With the help of these graphs and charts, employers can see trends, patterns, and other essential insights. This is like revealing the strengths and weaknesses of your business and rectifying issues. Read More: How low-code approach can fit into the DevOps culture? What’s the role of Microsoft Power BI in the business? Microsoft Power BI plays a crucial role in businesses by helping them make sense of their data. It helps you when you have large amounts of business data scattered from segments such as Delivery, customer portals, feedback, sales, etc. It gathers data from different sources and organizes it perfectly in the form of charts and graphs to help you make informed decisions. For example, if you have a general store, Power BI can show you graphically which products are flying off the shelves and which ones need a little boost. The best part of Power BI is that it lets you share these insights with your team so that everyone can be in the same lane. Everyone can learn what's really going on and what’s not. So, what are you waiting for? Make your business smarter and digital with Power BI development services. Is Power BI the same as Excel? Although both Excel and Power BI are used for data analysis, their capabilities differ. The following are the critical differences: Microsoft Excel can only manage a limited amount of data, but Power BI can handle massive amounts of data. Power BI can connect to a wide variety of data sources, but Excel has restricted connection capabilities. More importantly, Power BI is easy to use from mobile devices, whereas MS Excel is tough. Is coding required for Power BI? Power BI does not require any code. Instead, it employs formula languages such as DAX (Data Analysis Expressions) and M. What’s more interesting about this impeccable platform is that it does not let you depend on coding language options, rather its scope of capabilities is enough for data transformation, modeling, and visualization. Wave goodbye to tedious tasks with Microsoft 365 development services. Hire us now Power App development process: A brief overview Now that you have an idea about what Power Apps is and how crucial it is for low-code application development. Let's understand about Power App development process in simple steps: Step 1: Define Your Purpose What do you want your app to do? First, define your core purpose. What challenges will your solution solve or streamline? Step 2: Plan Your App Sketch it out: Before getting into the technical stuff, prepare an outline or rough sketch about your app design, look, features, and functions. In addition, do consider its look in different screens. Step 3: Set Up Your Power App Environment Get ready with app development Log in to the Power Apps platform and set up your development environment. This is where you'll bring your app to life. Meanwhile, understand the purpose and differences between No code, low-code, and custom code development Step 4: Choose a Design Template What’s best about Power Apps is that it offers hundreds of design templates. Check them out, and pick the one that suits your app's purpose. You may also start with a blank canvas to custom-design it from scratch. Step 5: Build Your App Drag and drop: Make use of the Power App builder which allows you to drag and drop different elements onto your canvas. Connect these elements and develop functionalities that you envisioned in the planning stage. Step 6: Define Data Sources Where's your data coming from? Integrate your app with data sources like Microsoft Excel, SharePoint, or other databases to ensure your app has the information it needs. Step 7: Add Logic and Functionality Make it work: Use Power Automate to add logic and automate processes within your app. For example, you can set up approval workflows or notifications. Step 8: Test Your App Before you launch your application, make sure you test it properly and effectively. Consider if all the added features work as per expectation. Does all the data flow correctly? And so on. Read More: How Low Code Development is Driving Innovation in Software Companies? Step 9: Get Feedback Ask for opinions: Share your business app with a small group of users be it colleagues, friends, etc. Gather feedback and make any necessary adjustments. Step 10: Deploy Your App Go live: When you feel your application is ready for live, deploy it and distribute it to your target audience. Gather feedback (consider both positives and negatives), and then work on critical improvements. Step 11: Monitor and Update Keep an eye on things:Regularly check how your app is performing. As user feedback and ratings play a critical role, make improvements based on them. By following these steps, you can navigate the Power App development process in a clear and organized manner. Enhance your business efficiency with an eminent Office Add-in development company Get in touch Phases of Power BI development Now that you have a clear idea about what Power BI is and how well it gathers and scatters data of all types (be it from sales, customer service, and other areas) and turns them into colorful pictures, charts, and graphs to show a clear story. Let us now understand the phases of Power BI development. Given below are the different phases of Power BI development: Phase 1: Planning Begin by identifying your requirements. For example, what type of insights you are looking for? Specific requirements (if any) for reporting and analytics. Outline the objectives you wanna achieve. Phase 2: Data Preparation Collect relevant data from various sources, like Excel files, online services, databases, etc. Now use Power Query in Power BI to transform this raw data into a usable format. Cleanse, filter, and shape the data to fit your reporting needs. Phase 3: Model Building To do this, create a data model and define relationships between distinct tables. This phase is essential for Power BI to understand how data is linked and to do appropriate analysis. Next, Use Data Analysis Expressions (DAX) to create calculations and measures that provide valuable insights. This could include creating custom metrics or aggregating data in specific ways. Read More: The Facts About White Label Multi-Service App Solutions: Dispelling the False Talks Phase 4: Report and Dashboard Creation Use the Power BI Report Builder to create interactive reports. Select visualizations that effectively depict your data, such as charts, tables, and maps. Create dynamic dashboards by combining various reports. Dashboards provide you with a high-level summary and allow you to delve down into specifics. Phase 5: Reports Deployment Deploy your Power BI reports and dashboards to the Power BI service. Share them with your team to access the real-time data. Phase 6: Usage Monitoring and Optimization Keep track of user interaction with your reports and dashboards and monitor their behavior to learn which visualizations are most valuable. Accordingly, make adjustments. To optimize Power BI performance, make sure you - Refine data models Optimize report loading speed and Improve user experience Phase 7: Training and Support Provide user training and continuous assistance for questions and upgrades to suit changing company needs. This is a critical stage in maximizing the benefits of the designed solution. These are the critical phases you may systematically develop and implement as a Power BI solution and meet your data reporting needs in your organization. PowerApps vs Power BI: Conclusion Power BI and Power Apps development have become buzzwords these days. And why not, after all, they have some amazing features that make development and analysis so simple and effective. Microsoft PowerApps is a popular low-code development tool for creating bespoke applications across several domains. Microsoft Power BI, on the other hand, is a super-smart application that helps firms manage their corporate data effortlessly and effectively. This blog has gone through the basics and differences between PowerBI and Power App development platforms in detail. We've also discussed how important they are in today's business context, the PowerApp custom development process, and the Power BI phases. Hope you have understood the essentials of these two leading platforms. For more informative posts, visit our blog section.
Kapil Panchal

Kapil Panchal

A passionate Technical writer and an SEO freak working as a Content Development Manager at iFour Technolab, USA. With extensive experience in IT, Services, and Product sectors, I relish writing about technology and love sharing exceptional insights on various platforms. I believe in constant learning and am passionate about being better every day.

Build Your Agile Team

Enter your e-mail address Please enter valid e-mail

Categories

Ensure your sustainable growth with our team

Talk to our experts
Sustainable
Sustainable
 
Blog Our insights
Location Intelligence Use Cases, and Benefits

You must be wondering what exactly is Location Intelligence. To put it simply, it is basically a way of deriving actionable insights from geographic data and spatial relationships...

13 Ways Power Apps Simplifies eDiscovery

E-Discovery is a crucial process for legal research enabling lawyers to find the digital evidence they need. It involves finding, collecting, and filtering e-data related to their...

Top Data Analytics Trends You Can't Ignore

Can you believe that 147 zettabytes of data have already been created in 2024, and guess what? It is anticipated to be 180 zettabytes by 2025 (according to Statista). Now just think...