The performance of Power BI is significantly influenced by two essential factors: design consistency and the rapid loading of BI elements. This holds true whether you choose Tableau or Power BI for your dashboard.
With each part loaded on time presents a great user experience. Without this, it is ineffective.
In this blog, we will look at 19 Power BI Best Practices one should follow to improve report performance.
19 Best Practices for Using Power BI
If you do not comply with Power BI Performance best practices, then your dashboards will no longer be effective - making your visuals and reports slow, and cluttered. This eventually diminishes the value of your data analysis effort.
So, here’s the big question: What are the best practices for using Power BI effectively?
To answer this, we have brought the top best practices for effective Power BI usage, which helps you simplify and make your report more efficient.
Here are the top best Practices for effective Power BI usage, which will help you simplify and optimize your report.
1. Optimize Data Model
When was the last time you checked if your data model is slowing things down? A well-optimized data model makes your Power BI reports run smoothly.
Here's how you can do it:
Understanding Data Models: Imagine a messy room where finding anything takes much time. A cluttered data model works the same way—clean it up, and everything becomes faster.
Simplifying Data Relationships: Avoid making too many relationships in your data. It becomes complex and cluttered. It’s like having too many roads between two cities. Just simplify the path, and you’ll reach your destination faster.
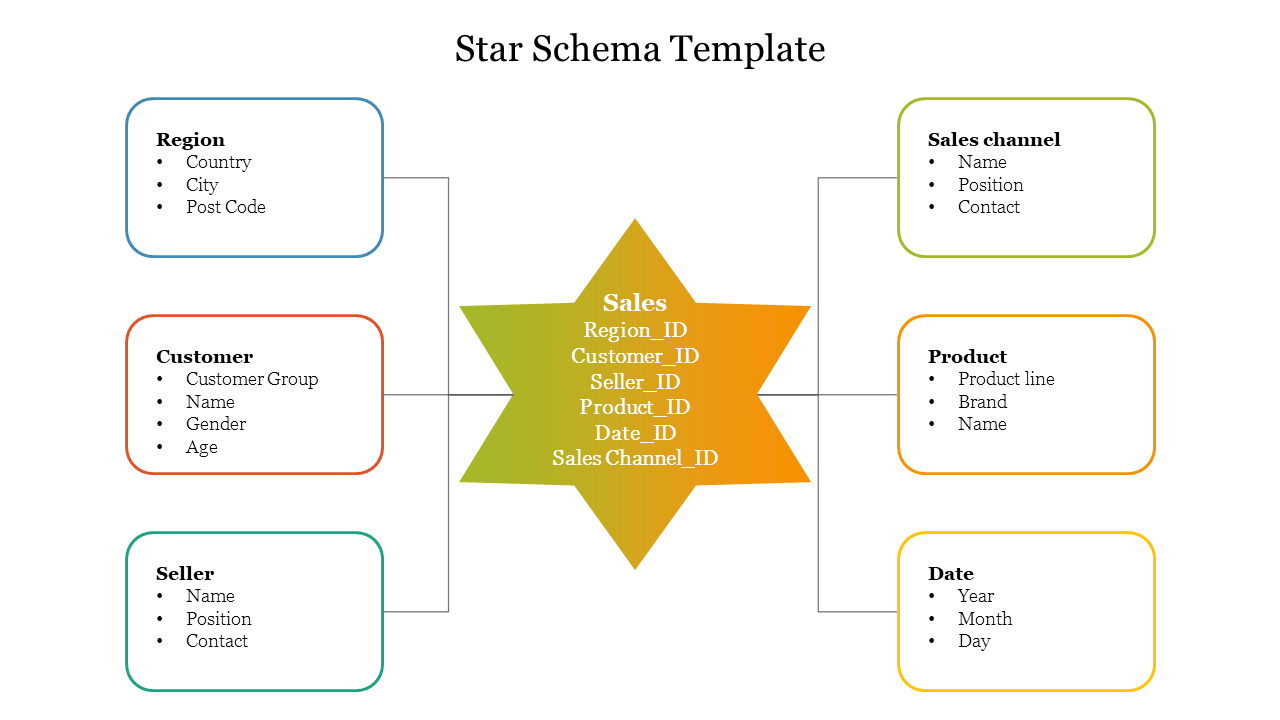
Using Star Schema:
It is always worth using start schema in your Data Modeling. Because it improves performance and the results you get are accurate. Think of a star schema like a railway hub. All data flows through a central station (fact table) and connects to different stations (dimension tables), making analysis efficient.
Have you ever been stuck waiting for a report to load because the data refresh was slow? I'm sure you have, right? Managing data refresh properly ensures your reports are always up to date without delays.
Here’s how you do Power BI Performance tuning.
Scheduling Data Refresh: Rather than going with frequent data updates, it’s better to set a schedule that works for your business. Because it is pointless if the data changes slowly.
Incremental Data Refresh: Why reload everything when only a small part has changed? Incremental refresh updates only the new data which saves considerable time and resources.
Take a look at these prime Power BI use cases we've crafted for our industry CTOs. These BI examples helped them simplify their operational decisions!
HealthTech
LegalTech
FinTech
4. Optimize DAX Calculations
Have you ever wondered why your DAX formulas take so long to calculate? It’s usually because they aren’t optimized. Getting DAX right makes your reports faster and smoother.
Basics of DAX: Think of DAX as the language of Power BI. Mastering it is like learning the basics of cooking—once you know the ingredients, you can create any dish.
Writing Efficient DAX Queries: Avoid overcomplicating DAX formulas. It's like following a simple recipe instead of overloading it with unnecessary steps.
Avoiding Common DAX Pitfalls: Watch out for common mistakes like using row context unnecessarily. It’s like adding salt twice—too much ruins the dish!
Do your reports feel heavy and slow? Overloaded visuals can drag down performance. Keeping visuals lean and relevant boosts both speed and user engagement.
Choosing the Right Visuals: Pick visuals that tell your story clearly. Using the wrong one is like trying to explain a movie plot with random pictures.
Reducing Visual Complexity: Too many details confuse viewers. It's like adding too many spices to a dish—keep it simple to retain the flavor.
Using Custom Visuals Wisely: Custom visuals can be powerful but overloading reports with them can slow things down. Try using them like enhancers which help you improve dashboard performance speed.
7. Limit the Number of Visuals on a Page
Ever walked into a cluttered room where everything screams for attention? That’s how a report feels with too many visuals. Keep it clean and focused.
Impact of Too Many Visuals:
Slows down report rendering.
Confuses the user with too much information.
Best Practices for Visual Layout:
Group similar visuals together.
Prioritize the most important information.
Enhancing User Experience:
A clean layout makes insights easier to grasp.
Use white space effectively to avoid clutter.
That's how you should follow Power BI best practices for superior outcomes.
DAX variables are like reusable shortcuts that make your formulas cleaner and faster. Why repeat the same thing when you can store it once and use it again?
Introduction to DAX Variables: Imagine storing a value in a container and using it multiple times—DAX variables work the same way.
Benefits of Using Variables:
Improve DAX readability.
Reduce calculation time by avoiding repeated expressions.
Examples of Variable Usage:
Use VAR to store intermediate results.
Apply variables to avoid redundant calculations in complex measures.
Here is an example of Power BI optimization.
9. Optimize Power Query
Power Query is where your data gets prepped before landing in Power BI. Keeping this step clean and efficient makes everything downstream run smoothly.
Power Query Basics Think of Power Query as your data kitchen where raw data gets chopped, cleaned, and prepared before it’s served.
Efficient Data Transformation:
Remove unnecessary columns early to reduce load.
Apply filters as soon as possible to limit the data size.
Best Practices for Power Query:
Use ‘Close & Load to Connection Only’ when tables don’t need to be loaded to the model.
Keep applied steps minimal—each extra step adds processing time.
These Power BI performance best practices help you improve report performance significantly.
10. Use DirectQuery Appropriately
DirectQuery is like ordering food directly from a restaurant instead of cooking at home. It’s fast but not always the best choice. Knowing when to use it can save time and resources.
Use DirectQuery when your data changes frequently or when dealing with massive datasets that are too big to import.
Performance Considerations: It’s quick but can slow down if too many visuals or complex queries are involved. It’s like ordering multiple dishes at once—too many can overwhelm the kitchen.
Combining DirectQuery with Import Mode: Use a hybrid model—store frequently accessed data in Import mode and use DirectQuery for real-time updates. Best of both worlds!
So that's how you enhance the performance of Power BI in another way.
Have you ever used a knife when you needed scissors? Choosing the wrong data type in Power BI can be just as inefficient. Optimizing data types improves performance and saves space.
Tips for Choosing the Right Data Types:
Tip-1: Use integers instead of decimals where possible.
Tip-2: Stick to Date instead of DateTime when time isn’t needed.
Tips for Converting Data Types:
Tip-1: Convert text columns to numeric or date when applicable.
Tip-2: Avoid unnecessary conversions that add extra load.
Thus, cutting the number of rows and columns impacts positively on the performance of Power BI.
13. Use Power BI Service Features
Why not take advantage of Power BI Service features to boost performance and efficiency? It’s like having an extra pair of hands to do the heavy lifting.
Utilizing Power BI Service:
Use Azure cloud services to share BI reports, schedule data refreshes, and collaborate easily.
Using Dataflows:
Dataflows allow you to preprocess and clean data before loading it into your model. This way you can optimize Power BI reports while saving time and effort.
Benefits of Power BI Premium:
Higher storage limits and faster refresh rates.
Ideal for firms managing large datasets and needing advanced capabilities.
Want to get the most out of Power BI licenses? Set up a consultation with our BI expert and get the best deals.
Our Power BI Templates
(Turning insights into various data visualizations)
Step Area Chart
Our Step Chart visualization built with Power BI provides a simple way to grasp complex time-related data, enabling faster, data-driven decision-making.
Why is it worth using?
Helps identify trends 40% more accurately.
Cuts analysis time by 25%.
Highly customizable.
Popular among over 250,000 professionals.
Speeds up data-driven decisions in Fortune 500 companies.
Pie Chart
This personalized pie chart brings data to life with labeled sections, vibrant colors, and interactive tooltips. Click on slices to explore details and filter insights effortlessly!
Why is it worth using?
Clear category representation.
Adaptable dynamic data.
Highly customizable.
Highlighting specific data points.
40% trend identification improvement.
25% analysis time reduction.
Bump Chart
Track ranking changes over time with our Bump Chart for Power BI. Gain clear insights into performance dynamics and compare entities effortlessly!
Why is it worth using?
Gain clarity on performance shifts over time.
Customized colors, and tooltips to fit your needs.
Ideal for data analysts, business leaders, and financial planners.
Make smarter decisions with trend insights.
Track rankings effortlessly for action.
14. Monitor Performance
How do you know if your car needs servicing? You check the dashboard. Monitoring Power BI performance works the same way—it helps you identify issues before they slow things down.
Tools for Monitoring Performance:
Use Performance Analyzer to track query times.
Check DAX Studio for optimizing DAX performance.
Analyzing Performance Metrics:
Identify slow-loading visuals and optimize them.
Monitor CPU and memory usage to prevent bottlenecks.
Continuous Improvement:
Regularly review and refine models.
Keep track of usage patterns to predict future performance needs.
Would you prefer a direct highway or a slow, winding road? Choosing and connecting to the right data sources in Power BI is just like that—it affects speed and performance.
Choosing the Right Data Sources:
Prefer cloud-based sources for faster connectivity.
Avoid using flat files for large datasets.
Connecting to Data Sources Efficiently:
Use DirectQuery only when real-time updates are needed.
Optimize SQL queries to reduce data retrieval time.
Managing Data Source Performance
Set up proper indexing in databases.
Limit unnecessary data pull with filters at the source.
Think of data compression like vacuum-packing clothes before a trip—it reduces space and makes things easier to manage. Compressing data in Power BI reduces file size and improves speed.
Benefits of Data Compression:
Smaller file size means faster load times.
Improves query performance by reducing data scan time.
Techniques for Compressing Data:
Use columnstore indexes to compress data.
Reduce cardinality by minimizing unique values in columns.
Have you ever checked your car’s mileage after a long drive? Power BI’s Performance Analyzer works the same way—it helps identify what’s slowing down your reports.
Introduction to Performance Analyzer:
It’s a built-in tool that tracks how long each visual, DAX query, and data load takes, helping you spot bottlenecks.
Using Performance Analyzer:
Open Performance Analyzer from the “View” tab.
Click “Start Recording” and refresh visuals to capture performance data.
Interpreting Results:
Identify visuals or queries taking too long.
Optimize DAX formulas or reduce visual complexity based on the findings
So, this concludes our blog on Power BI best practices. We hope you found this helpful and effective. Applying these Power BI tips and practices will help you improve your report performance and provide the best user experience.
Conclusion: Boost Your Power BI Performance Today!
Optimizing Power BI isn’t just about faster reports—it’s about ensuring smooth decision-making, reducing processing time, and maximizing system efficiency. By applying these best practices, you can enhance your report performance, improve user experience, and get real-time insights without delays.
At iFour, we specialize in simplifying complex BI challenges. Our experts help you:
Design optimized data models for faster performance.
Implement advanced DAX techniques to reduce query time.
Leverage incremental data refresh and aggregation for efficiency.
Let’s optimize your Power BI setup and transform your business insights! Contact iFour today to elevate your Power BI experience.
Power BI Performance Best Practices For Superior Results
The performance of Power BI is significantly influenced by two essential factors: design consistency and the rapid loading of BI elements. This holds true whether you choose Tableau or Power BI for your dashboard.
With each part loaded on time presents a great user experience. Without this, it is ineffective.
Maintaining design consistency helps you tell a coherent data story about your business and operations.
Following Power BI best practices is essential for ensuring optimal performance and user satisfaction. These practices include:
Optimizing data models,
Using efficient DAX formulas,
Minimizing the number of visuals on each BI report, and
Avoiding dashboard design mistakes while developing.
This way you can make your Business intelligence dashboards and reports load quickly with clear, and actionable insights.
Hire Power BI developers to create your custom CEO dashboards
Get in touch
In this blog, we will look at 19 Power BI Best Practices one should follow to improve report performance.
19 Best Practices for Using Power BI
If you do not comply with Power BI Performance best practices, then your dashboards will no longer be effective - making your visuals and reports slow, and cluttered. This eventually diminishes the value of your data analysis effort.
So, here’s the big question: What are the best practices for using Power BI effectively?
To answer this, we have brought the top best practices for effective Power BI usage, which helps you simplify and make your report more efficient.
Meanwhile, look at the expert discussion held on Reddit, and see what experts are saying about Power BI performance tuning.
Here are the top best Practices for effective Power BI usage, which will help you simplify and optimize your report.
1. Optimize Data Model
When was the last time you checked if your data model is slowing things down? A well-optimized data model makes your Power BI reports run smoothly.
Here's how you can do it:
Understanding Data Models: Imagine a messy room where finding anything takes much time. A cluttered data model works the same way—clean it up, and everything becomes faster.
Simplifying Data Relationships: Avoid making too many relationships in your data. It becomes complex and cluttered. It’s like having too many roads between two cities. Just simplify the path, and you’ll reach your destination faster.
Using Star Schema:
It is always worth using start schema in your Data Modeling. Because it improves performance and the results you get are accurate. Think of a star schema like a railway hub. All data flows through a central station (fact table) and connects to different stations (dimension tables), making analysis efficient.
In fact, this is one of the main reasons why professionals switch from Tableau to Power BI.
Image source
2. Use Query Reduction Techniques
Reducing query load is like giving your system a breather, making it perform well under pressure. Here's how to optimize the load:
Reducing Data Load:
Only load what you need. Loading unnecessary data slows you down.
Aggregate data when possible to reduce rows and columns.
Filtering Data at Source:
Apply filters directly at the source. Why filter after pulling data when you can do it at the start?
Use SQL queries to limit the data fetched from the database.
Using Query Folding:
Query folding pushes data transformations back to the source.
It’s like asking a chef to prepare your meal instead of cooking it yourself—saves you time and effort!
By managing the above aspects, you can optimize Power BI reports for better efficiency.
Read More: HR Analytics Dashboard – Key Metrics & Examples
3. Manage Data Refresh
Have you ever been stuck waiting for a report to load because the data refresh was slow? I'm sure you have, right? Managing data refresh properly ensures your reports are always up to date without delays.
Here’s how you do Power BI Performance tuning.
Scheduling Data Refresh: Rather than going with frequent data updates, it’s better to set a schedule that works for your business. Because it is pointless if the data changes slowly.
Incremental Data Refresh: Why reload everything when only a small part has changed? Incremental refresh updates only the new data which saves considerable time and resources.
Handling Large Datasets:
Break down large datasets into smaller chunks. It’s like splitting a large task into smaller ones—easier to handle and process.
Check out what modeling experts on Reddit have to say about Data Modeling - One Large Dataset or Several Smaller Datasets?
Take a look at these prime Power BI use cases we've crafted for our industry CTOs. These BI examples helped them simplify their operational decisions!
HealthTech
View Demo
Custom
LegalTech
View Demo
Custom
FinTech
View Demo
Custom
4. Optimize DAX Calculations
Have you ever wondered why your DAX formulas take so long to calculate? It’s usually because they aren’t optimized. Getting DAX right makes your reports faster and smoother.
Basics of DAX: Think of DAX as the language of Power BI. Mastering it is like learning the basics of cooking—once you know the ingredients, you can create any dish.
Writing Efficient DAX Queries: Avoid overcomplicating DAX formulas. It's like following a simple recipe instead of overloading it with unnecessary steps.
Avoiding Common DAX Pitfalls: Watch out for common mistakes like using row context unnecessarily. It’s like adding salt twice—too much ruins the dish!
Inspect your Business progress seamlessly with our Dashboard Development Services
Avail services now
Image source
5. Use Aggregations
Why process millions of rows when you can summarize data in advance? Aggregations simplify complex calculations and speed up Power BI performance
Benefits of Aggregations:
Reduce data processing time by summarizing data.
Improve query performance by minimizing data scans.
Creating Aggregated Tables:
Pre-aggregate data at different levels.
Store these summarized results in separate tables for faster access.
Managing Aggregations:
Keep your aggregation tables updated to ensure accuracy.
Use storage modes like DirectQuery or Import based on your data needs.
Read More: 16 Power BI Dashboard Design Mistakes to Avoid
6. Optimize Visuals
Do your reports feel heavy and slow? Overloaded visuals can drag down performance. Keeping visuals lean and relevant boosts both speed and user engagement.
Choosing the Right Visuals: Pick visuals that tell your story clearly. Using the wrong one is like trying to explain a movie plot with random pictures.
Reducing Visual Complexity: Too many details confuse viewers. It's like adding too many spices to a dish—keep it simple to retain the flavor.
Using Custom Visuals Wisely: Custom visuals can be powerful but overloading reports with them can slow things down. Try using them like enhancers which help you improve dashboard performance speed.
7. Limit the Number of Visuals on a Page
Ever walked into a cluttered room where everything screams for attention? That’s how a report feels with too many visuals. Keep it clean and focused.
Impact of Too Many Visuals:
Slows down report rendering.
Confuses the user with too much information.
Best Practices for Visual Layout:
Group similar visuals together.
Prioritize the most important information.
Enhancing User Experience:
A clean layout makes insights easier to grasp.
Use white space effectively to avoid clutter.
That's how you should follow Power BI best practices for superior outcomes.
Move your data analytics effectively with Power BI Migration services
Let’s discuss now
8.Use Variables in DAX
DAX variables are like reusable shortcuts that make your formulas cleaner and faster. Why repeat the same thing when you can store it once and use it again?
Introduction to DAX Variables: Imagine storing a value in a container and using it multiple times—DAX variables work the same way.
Benefits of Using Variables:
Improve DAX readability.
Reduce calculation time by avoiding repeated expressions.
Examples of Variable Usage:
Use VAR to store intermediate results.
Apply variables to avoid redundant calculations in complex measures.
Here is an example of Power BI optimization.
9. Optimize Power Query
Power Query is where your data gets prepped before landing in Power BI. Keeping this step clean and efficient makes everything downstream run smoothly.
Power Query Basics Think of Power Query as your data kitchen where raw data gets chopped, cleaned, and prepared before it’s served.
Efficient Data Transformation:
Remove unnecessary columns early to reduce load.
Apply filters as soon as possible to limit the data size.
Best Practices for Power Query:
Use ‘Close & Load to Connection Only’ when tables don’t need to be loaded to the model.
Keep applied steps minimal—each extra step adds processing time.
Read More: 10 Executive Dashboard Examples for Consultants and CEOs
These Power BI performance best practices help you improve report performance significantly.
10. Use DirectQuery Appropriately
DirectQuery is like ordering food directly from a restaurant instead of cooking at home. It’s fast but not always the best choice. Knowing when to use it can save time and resources.
When to Use DirectQuery:
Use DirectQuery when your data changes frequently or when dealing with massive datasets that are too big to import.
Performance Considerations: It’s quick but can slow down if too many visuals or complex queries are involved. It’s like ordering multiple dishes at once—too many can overwhelm the kitchen.
Combining DirectQuery with Import Mode: Use a hybrid model—store frequently accessed data in Import mode and use DirectQuery for real-time updates. Best of both worlds!
So that's how you enhance the performance of Power BI in another way.
Drive innovation through Power Platform development services
Hire us now
11. Optimize Data Types
Have you ever used a knife when you needed scissors? Choosing the wrong data type in Power BI can be just as inefficient. Optimizing data types improves performance and saves space.
Tips for Choosing the Right Data Types:
Tip-1: Use integers instead of decimals where possible.
Tip-2: Stick to Date instead of DateTime when time isn’t needed.
Tips for Converting Data Types:
Tip-1: Convert text columns to numeric or date when applicable.
Tip-2: Avoid unnecessary conversions that add extra load.
Impact on Performance of Power BI:
Smaller data types consume less memory, speeding up query performance.
Large or complex data types slow down processing.
Read More: How to Export Power BI Data to Excel
12. Reduce the Number of Columns and Rows
More data isn’t always better—sometimes it just slows things down. Reducing the size of your dataset keeps performance smooth and efficient.
Importance of Data Reduction:
Smaller datasets load faster and improve query performance.
Less data means fewer resources are consumed.
Techniques for Reducing Data:
Remove unused columns.
Apply filters to limit rows before loading data.
Use summarized data when details aren’t necessary.
Impact on Performance:
Faster report loading (improve report performance).
Reduced memory consumption and processing time.
Thus, cutting the number of rows and columns impacts positively on the performance of Power BI.
13. Use Power BI Service Features
Why not take advantage of Power BI Service features to boost performance and efficiency? It’s like having an extra pair of hands to do the heavy lifting.
Utilizing Power BI Service:
Use Azure cloud services to share BI reports, schedule data refreshes, and collaborate easily.
Using Dataflows:
Dataflows allow you to preprocess and clean data before loading it into your model. This way you can optimize Power BI reports while saving time and effort.
Benefits of Power BI Premium:
Higher storage limits and faster refresh rates.
Ideal for firms managing large datasets and needing advanced capabilities.
Want to get the most out of Power BI licenses? Set up a consultation with our BI expert and get the best deals.
Our Power BI Templates
(Turning insights into various data visualizations)
Step Area Chart
Our Step Chart visualization built with Power BI provides a simple way to grasp complex time-related data, enabling faster, data-driven decision-making.
Why is it worth using?
Helps identify trends 40% more accurately.
Cuts analysis time by 25%.
Highly customizable.
Popular among over 250,000 professionals.
Speeds up data-driven decisions in Fortune 500 companies.
View Live Demo
Pie Chart
This personalized pie chart brings data to life with labeled sections, vibrant colors, and interactive tooltips. Click on slices to explore details and filter insights effortlessly!
Why is it worth using?
Clear category representation.
Adaptable dynamic data.
Highly customizable.
Highlighting specific data points.
40% trend identification improvement.
25% analysis time reduction.
View Live Demo
Bump Chart
Track ranking changes over time with our Bump Chart for Power BI. Gain clear insights into performance dynamics and compare entities effortlessly!
Why is it worth using?
Gain clarity on performance shifts over time.
Customized colors, and tooltips to fit your needs.
Ideal for data analysts, business leaders, and financial planners.
Make smarter decisions with trend insights.
Track rankings effortlessly for action.
View Live Demo
14. Monitor Performance
How do you know if your car needs servicing? You check the dashboard. Monitoring Power BI performance works the same way—it helps you identify issues before they slow things down.
Tools for Monitoring Performance:
Use Performance Analyzer to track query times.
Check DAX Studio for optimizing DAX performance.
Analyzing Performance Metrics:
Identify slow-loading visuals and optimize them.
Monitor CPU and memory usage to prevent bottlenecks.
Continuous Improvement:
Regularly review and refine models.
Keep track of usage patterns to predict future performance needs.
Build your apps in no time with a Low code app development services
Contact now
15. Optimize Report Layout
Does your report feel cluttered? A well-organized layout not only looks better but also improves performance and enhances user experience.
Designing User-Friendly Reports:
Design with the audience in mind—keep the layout clean and intuitive.
Best Practices for Layout:
Prioritize key information at the top.
Use fewer visuals to avoid clutter.
Group related data logically for easier navigation.
Enhancing Report Readability:
Use consistent colors and fonts.
Maintain adequate spacing to reduce cognitive load.
16. Use Incremental Load
Why reload everything when only a small portion of your data has changed? Incremental load updates just the new data, saving time and resources.
Benefits of Incremental Load:
Faster data refresh by processing only changed data.
Reduces load on the system, preventing unnecessary processing.
Setting Up Incremental Load:
Define a date or key column to track changes.
Configure incremental policies in Power BI settings.
Managing Incremental Data:
Regularly validate that data is refreshing correctly.
Monitor incremental refresh policies to avoid data gaps.
Read More: 8 Powerful Data Storytelling Examples for CTOs
17. Optimize Data Sources
Would you prefer a direct highway or a slow, winding road? Choosing and connecting to the right data sources in Power BI is just like that—it affects speed and performance.
Choosing the Right Data Sources:
Prefer cloud-based sources for faster connectivity.
Avoid using flat files for large datasets.
Connecting to Data Sources Efficiently:
Use DirectQuery only when real-time updates are needed.
Optimize SQL queries to reduce data retrieval time.
Managing Data Source Performance
Set up proper indexing in databases.
Limit unnecessary data pull with filters at the source.
Improve your Trades strategy with custom Sales dashboard development .
Contact now
18. Use Compression Techniques
Think of data compression like vacuum-packing clothes before a trip—it reduces space and makes things easier to manage. Compressing data in Power BI reduces file size and improves speed.
Benefits of Data Compression:
Smaller file size means faster load times.
Improves query performance by reducing data scan time.
Techniques for Compressing Data:
Use columnstore indexes to compress data.
Reduce cardinality by minimizing unique values in columns.
Impact on Performance:
Less memory consumption during query execution.
Better overall system responsiveness.
Read More: 19 Power BI Case Studies That Showcase Real-World Success
19. Leverage Power BI Performance Analyzer
Have you ever checked your car’s mileage after a long drive? Power BI’s Performance Analyzer works the same way—it helps identify what’s slowing down your reports.
Introduction to Performance Analyzer:
It’s a built-in tool that tracks how long each visual, DAX query, and data load takes, helping you spot bottlenecks.
Using Performance Analyzer:
Open Performance Analyzer from the “View” tab.
Click “Start Recording” and refresh visuals to capture performance data.
Interpreting Results:
Identify visuals or queries taking too long.
Optimize DAX formulas or reduce visual complexity based on the findings
So, this concludes our blog on Power BI best practices. We hope you found this helpful and effective. Applying these Power BI tips and practices will help you improve your report performance and provide the best user experience.
Conclusion: Boost Your Power BI Performance Today!
Optimizing Power BI isn’t just about faster reports—it’s about ensuring smooth decision-making, reducing processing time, and maximizing system efficiency. By applying these best practices, you can enhance your report performance, improve user experience, and get real-time insights without delays.
Why Choose iFour for Power BI consulting services?
At iFour, we specialize in simplifying complex BI challenges. Our experts help you:
Design optimized data models for faster performance.
Implement advanced DAX techniques to reduce query time.
Leverage incremental data refresh and aggregation for efficiency.
Let’s optimize your Power BI setup and transform your business insights! Contact iFour today to elevate your Power BI experience.
Kapil Panchal
A passionate Technical writer and an SEO freak working as a Content Development Manager at iFour Technolab, USA. With extensive experience in IT, Services, and Product sectors, I relish writing about technology and love sharing exceptional insights on various platforms. I believe in constant learning and am passionate about being better every day.
Selecting the right project management software helps you complete tasks on time with accuracy. Whether your team has five people or five hundred, choosing the right solution is essential...
AI agents are everywhere these days.
The world's biggest tech players - Microsoft, Alphabet, Amazon, and Meta are investing heavily in AI infrastructure, with spending expected...
You already know how healthcare creates tons of clinical data every day. Patient visits… Labs… EMRs… doctor portals… scheduling systems… everything is generating numbers nonstop.
But...


