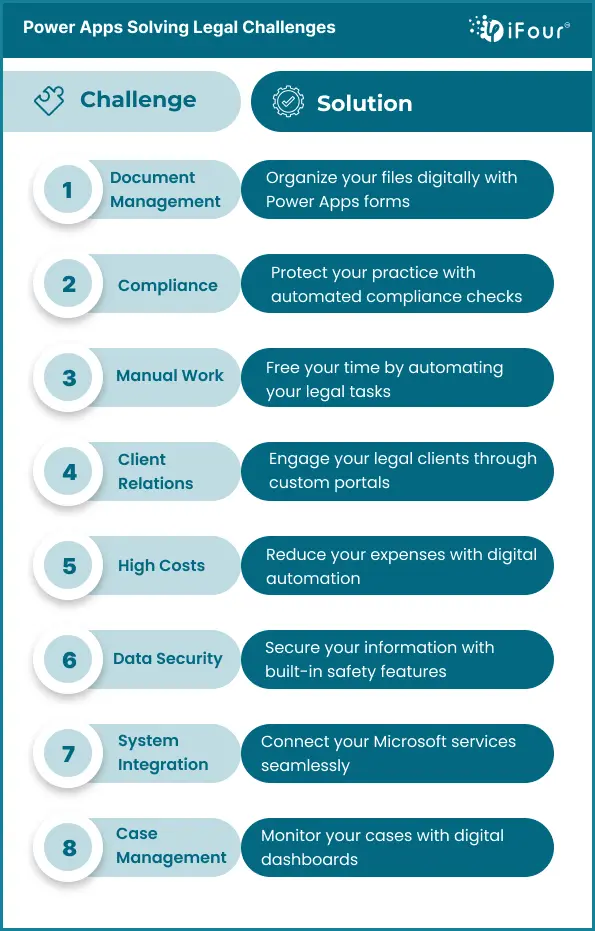
13 Challenges Power Apps solves in the legal industry
Microsoft Power Apps is a simple, effective, and secure technology. It is a part of Microsoft and can be managed effortlessly by non-tech attorneys and legal consultants. Let’s check out what are the challenges legal professionals face and how Power Apps helps solve legal challenges.
Challenge 1: Inefficient Document Management
Inefficient document management can cause delays, errors, and productivity issues for businesses. Employees often struggle to locate files, ensure version control, or maintain consistent workflows, leading to confusion and wasted time. Without a structured system, managing documents manually can result in data loss, errors in processing, and compliance risks.
Solution: Power Apps for Custom Forms and Workflows
One of the utmost solutions is Power Apps for legal challenges, providing solutions to your documentation and legal risks. Power Apps offers a solution by enabling businesses to create custom forms and workflows tailored to their specific document management needs. Through Power Apps, enterprises can automate document storage, categorization, and retrieval, ensuring that every file is easily accessible and accurately stored.
Using Power Apps, teams can create forms to capture relevant document data and initiate automated approval processes, reducing the need for manual intervention and minimizing errors. Integration with Microsoft services like SharePoint and OneDrive ensures that files are stored securely in the cloud, maintaining version control and audit trails. Furthermore, automated workflows in Power Apps help manage document reviews, approvals, and notifications, improving efficiency and streamlining the entire process.
This approach not only reduces time spent on document handling but also ensures accuracy and compliance, allowing employees to focus on more critical tasks.
Challenge 2: Limited Data Visibility
When organizations cannot easily see and understand their data, it makes it harder to make informed decisions. This is especially true in legal services where tracking case progress, billable hours, and deadlines is essential. Without proper data visibility, teams may miss key insights, struggle with performance tracking, and experience delays in decision-making.
Solution: Power BI Dashboards for Clear Insights
With Power BI in Power Apps solution helps you solve this problem by creating easy-to-understand dashboards that display all the important data in one place. It gathers data from different sources, like case management systems and billing tools, and presents it visually through graphs and charts.
With Power BI dashboards, legal teams can quickly see key metrics like case status, workload, and billing details. This makes it easier to track performance, identify issues early, and make data-driven decisions. The result is better management of cases, improved efficiency, and a clear picture of how the legal team is performing.
Challenge 3: Complex Case Tracking
Managing complex legal cases can be challenging especially when tracking multiple deadlines, assignments, and case progress across teams. Without a system, legal teams may struggle to stay organized, leading to missed deadlines, inefficient workflows, and difficulty coordinating tasks. Depending on traditional methods like spreadsheets or paper files makes it even harder to track case details accurately, which can impact client satisfaction and case outcomes.
Take a look at these prime Power BI use cases we've crafted for our industry CTOs. These BI examples helped them simplify their operational decisions!
Solution: Power Apps for Custom Case Management
Power Apps provides an effective solution by enabling legal teams to create custom case management applications to their needs. These apps can be designed to track case progress, manage deadlines, assign tasks, and store critical information in one centralized platform. By automating workflows, Power Apps ensures that all case-related activities are streamlined and easily accessible by the entire team.
Using custom forms and dashboards, teams can track the status of each case, set reminders for upcoming deadlines, and assign tasks to the right team members. Integration with other Microsoft tools like Outlook and Teams helps further streamline communication and case management.
This approach simplifies complex case tracking, reduces the risk of missed deadlines, and improves collaboration across legal teams, ultimately leading to more efficient case handling and better client outcomes.
Challenge 4: Slow Communication
Slow communication can significantly impact productivity and client service, especially in industries like legal services where timely responses are crucial. Delays in communication between team members, clients, and other stakeholders can lead to misunderstandings, missed deadlines, and reduced client satisfaction. Without an efficient way to manage communications, teams struggle to stay aligned, impacting case progress and overall service quality.
Solution: Power Apps for Faster Communication
Power Apps can solve this problem by integrating with email and collaboration tools, allowing for faster, more streamlined communication. By connecting Power Apps with platforms like Outlook, Microsoft Teams, and other messaging systems, legal teams can automate notifications, updates, and reminders, ensuring that critical information is shared in real time.
In the Power Apps, one can create custom communication features within case management apps, automatically sending email alerts for case updates, task assignments, or approaching deadlines. Integration with collaboration tools like Teams allows for instant messaging and real-time discussions, keeping everyone informed without relying on lengthy email chains.
This integration speeds up communication, improves team collaboration, and ensures clients are updated quickly, enhancing service quality. By centralizing communication in a single platform, teams can reduce delays and provide a more responsive, client-focused experience.
Challenge 5: Lack of Automation
In the legal industry, many teams still rely on manual processes for tasks like document generation, data entry, and email notifications. This lack of automation can lead to inefficiencies, increased errors, and wasted time, ultimately impacting productivity and client service. Repetitive tasks consume valuable resources that could be better spent on more strategic activities, hindering overall operational effectiveness.
Solution: Legal Workflow Automation with Power Apps
Power Apps offers a powerful solution for automating these repetitive tasks, allowing legal teams to streamline their workflows and focus on what matters most. By implementing legal workflow automation with Power Apps, teams can create applications that automatically generate documents based on templates, reducing the time spent on paperwork.
Power Apps can be used to automate data entry processes by integrating with existing databases and management systems. This ensures that information is entered accurately and consistently, minimizing the risk of errors. Email notifications can also be automated, keeping team members and clients informed of important updates and deadlines without manual efforts.
Challenge 6: Difficulty in Scaling
As law firms expand, they often encounter difficulties in scaling their operations to manage increased workloads and a growing client base. Traditional processes and systems may struggle to keep pace, resulting in inefficiencies, potential errors, and a decline in service quality. Without the ability to scale effectively, firms risk losing opportunities and compromising client satisfaction.
Solution: Scalable Operations with Power Apps
Power Apps offers a robust solution for scalability, enabling law firms to adapt to growth seamlessly. With Power Apps, firms can develop custom applications tailored to their specific needs, allowing them to handle more cases and clients without sacrificing efficiency.
The platform’s flexibility means that as your firm’s demands increase, you can easily enhance existing applications or create new ones to accommodate changes. This could involve automating additional tasks, integrating new data sources, or expanding reporting capabilities all without the need for extensive IT resources.
Challenge 7: Compliance Challenges
Legal firms often struggle with compliance, needing to follow various regulations and protect client data. Keeping track of these requirements can be overwhelming, and failing to comply can lead to serious penalties and a loss of client trust.
Solution: Power Apps for Legal Compliance Tracking
Power Apps offers a straightforward solution for managing compliance challenges. By using Power Apps for legal compliance tracking, firms can create custom applications designed to meet their specific regulatory needs.
Power Apps can also connect with other data sources to ensure that records are always current and compliant with data privacy laws. By implementing Power Apps, legal firms can simplify their compliance processes, reduce risks, and maintain a strong commitment to meeting regulatory standards, ultimately enhancing trust and accountability with clients.
Challenge 8: High Costs
Legal firms often comes with high operational costs associated with manual processes, inefficient workflows, and the need for multiple software solutions. These expenses can quickly add up, affecting profitability and limiting resources available for other critical areas, such as client service and business development. As firms grow, managing these costs becomes increasingly challenging and many struggle to find cost-effective ways to improve efficiency.
Solution: Power Apps for Cost-Effective Automation
Power Apps provides a cost-effective solution for automating legal processes, helping firms reduce operational costs while enhancing efficiency. With Power Apps legal teams can build custom applications tailored to their specific needs without the high price tag of traditional software solutions.
By automating routine tasks such as document generation, data entry, and case management Power Apps minimizes the need for extensive manual work, allowing staff to focus on higher-value activities.
Challenge 9: Limited Integration Capabilities
Many legal firms face challenges with limited integration capabilities among their software solutions, leading to inefficient workflows. When different systems do not communicate effectively, it becomes difficult to share information, track case progress, or manage client interactions. This lack of integration can hinder productivity, create errors, and ultimately impact client service.
Solution: Power Apps for Seamless Integration
Power Apps provides a robust solution for overcoming integration challenges by connecting with other Microsoft 365 tools, such as SharePoint, Teams, and Outlook. This integration allows legal teams to access and share information effortlessly across different applications, improving collaboration and streamlining workflows.
Additionally, Power Apps can be connected to various third-party applications through APIs, enabling firms to consolidate their tech stack and ensure that all necessary tools work together. Whether it is integrating with case management systems, billing software, or customer relationship management CRM tools, Power Apps helps to enhances operational efficiency.
By using Power Apps for integration, legal firms can create a technology environment that supports better data sharing, communication, and collaboration. This leads to improved efficiency, reduced errors, and a more streamlined approach to managing legal processes, ultimately enhancing client satisfaction and firm performance.
Challenge 10: Lack of Customization
Legal firms often face the challenge of using all software solutions that do not cater to their unique processes and requirements. This lack of customization can lead to inefficiencies, as generic tools may not address specific workflows, compliance needs, or client management strategies. As a result, legal teams may find themselves adapting their processes to fit the software, which can reduce the productivity and overall effectiveness.
Solution: Power Apps for Customized Legal Solutions
Power Apps offers a powerful solution for overcoming the limitations of standard software by enabling legal firms to create highly customized applications tailored to their specific needs. With its user-friendly interface and low code platform, legal professionals can design applications that reflect their workflows, and compliance requirements.
Challenge 11: Limited Mobile Access
Lawyers and support staff frequently find themselves out of the office, attending court hearings, client meetings, or working remotely. In these situations, the inability to access case files, documents, and communication tools can lead to delays in decision-making and response times, ultimately affecting client satisfaction and case outcomes.
Solution: Power Apps for Mobile Accessibility
Power Apps addresses this challenge by providing robust mobile capabilities that enable legal teams to access and manage their legal data from anywhere. With Power Apps, firms can develop custom applications optimized for mobile devices, allowing users to view case details, update information, and generate documents on the go.
These mobile applications are designed with a user-friendly interface, ensuring that legal professionals can easily navigate and perform necessary tasks without being tied to their desks. Whether in court or on a business trip, users can stay connected and responsive, leading to improved productivity and collaboration.
Power Apps for mobile access, legal firms can enhance their operational flexibility, ensuring that team members have the information they need whenever and wherever they need it. This capability not only boosts efficiency but also elevates the overall client experience.
Challenge 12: Resistance to Change
Resistance to change is a common challenge many legal firms face when introducing new technologies. Employees may not like to adopt Power Apps due to a fear of the unknown, concerns about the learning curve or a preference for established processes. This can stop the successful implementation of digital transformation initiatives, leading to missed opportunities for efficiency and productivity gains.
Solution: Training and Support for Adoption
To overcome change, it is essential to provide comprehensive training and support for your team. By offering targeted training sessions on Power Apps, legal professionals can gain hands on experience and develop the necessary skills to use the platform effectively. This training should focus on how Power Apps can simplify their daily tasks, improve workflows, and ultimately enhance client service.
Challenge 13: Lack of Expertise
Many legal firms face the challenge of lacking the in-house expertise necessary to effectively implement and utilize new technologies like Power Apps. This gap in knowledge can lead to difficulties in developing custom applications that align with specific legal workflows and requirements. Without the right skills, firms may struggle to maximize the potential of Power Apps, making their ability to streamline processes and improve efficiency.
Solution: Partner with a Power Apps Development Company
To address this lack of expertise, legal firms can benefit from partnering with a specialized Power Apps development firm. By collaborating with experienced professionals, firms can leverage their technical knowledge to design and build custom solutions tailored to their unique needs.
A dedicated development firm can assist in creating applications that automate workflows, enhance case management, and improve client interactions, ensuring that the solutions are not only functional but also user-friendly. Furthermore, these experts can provide guidance on best practices, integration with existing systems, and ongoing support to optimize the use of Power Apps.
So that’s it about Power Apps for legal challenges and the corresponding solutions that effectively help you manage legal risks while optimizing workflows. Hope this helps!


