Top Business Intelligence Reporting Tools for CTOs
It’s difficult to believe, but there are about 426 Business Intelligence tools available! And the leaders in this field are Tableau, holding a 12.37% market share, and Power BI, which...
Vinod Satapara - December 25, 2024
Listening is fun too.
Straighten your back and cherish with coffee - PLAY !
HR analytics, generally known as People Analytics, could be a solid answer to those sceptics who believe that the HR department's role is just about hiring and making offers!
This is truly the key department which defines your path to business success. So, operating it strategically is essential to yield positive results. This is where HR Analytics dashboards come into play. It lets you
According to Deloitte, companies with happy, collaborative, and diverse teams see
Building a sense of belonging really pays off!
HR Analyticsis all about collecting and analyzing data about your employees to make smarter decisions. Think of it like using data to understand things like performance, engagement, and enrollment better.
Human Resources Dashboards can be built through various technologies like Looker, Domo, Power BI or Tableau. The best one depends on your specific demands and needs.
These HR dashboards give you a clear view of your firm & staff data, helping you manage your talent more effectively.
Now what can you do with the HR analytics dashboard?
It involves using stats, data visualization, and predictive tools to spot patterns in your workforce data.
Hire Power BI developers to simplify your data journey!
In short, the aim of using HR Analytics dashboard is to shift from traditional HR practices to a data-driven approach for solving people-related issues.
HR Analytics ensures that decisions are data-driven rather than based on assumptions. This leads to greater transparency and accountability within the organization. It supports strategic workforce planning by forecasting trends, preparing for future talent needs, and ensuring compliance with labour regulations.
HR Analytics analyzes data to determine the best hiring methods, ensuring the right person gets the job rather than making decisions based on feelings or guesswork.
Using HR Analytics, HR can figure out where people’s skills are being used best and where the company might be over or understaffed, making sure everything runs smoothly. By looking at salary data, benefits, and productivity, HR Analytics helps the company save money by optimizing its workforce and compensation packages.
It also can predict things like which employees might leave or what skills will be needed in the future, so the company can plan ahead.
HR analytics focuses on gathering and analyzing workforce data to make better decisions. Organizations can identify trends, address issues, and improve performance by tracking key metrics. Here are some essential HR analytics metrics
Improve enterprise productivity with expert Power Automate consulting services
Employee Turnover Rate :
It Measures how often employees leave the company. High turnover can signal dissatisfaction, poor management, or lack of growth opportunities.
Time to Hire:
Tracks the average time that takes to fill open positions. Longer times may indicate inefficiencies in the hiring process.
Employee Engagement:
Surveys and feedback are common ways to measure engagement.
Training and Development ROI:
Evaluates the effectiveness of training programs b y comparing their cost to the resulting improvement in employee performance.
Diversity and Inclusion Metrics:
Tracks the representation of different groups within the workforce. This helps ensure fair opportunities and a more innovative work environment.
Performance Metrics:
Includes individual and team productivity, goal completion rates, and other indicators of effectiveness.
Cost per Hire:
Analyzes the total recruitment cost per new employee. It helps optimize recruitment budgets.
Internal Mobility Rate:
Tracks the movement of employees within the organization. A high rate can indicate a strong focus on career growth.
Achieve seamless integration through expert Power Platform consulting
Now you know how the HR analytics dashboard assists HR teams gain actionable insights spanning employee performance, workforce trends, and company health. Let’s understand with some of the best examples and case studies of HR Analytics:
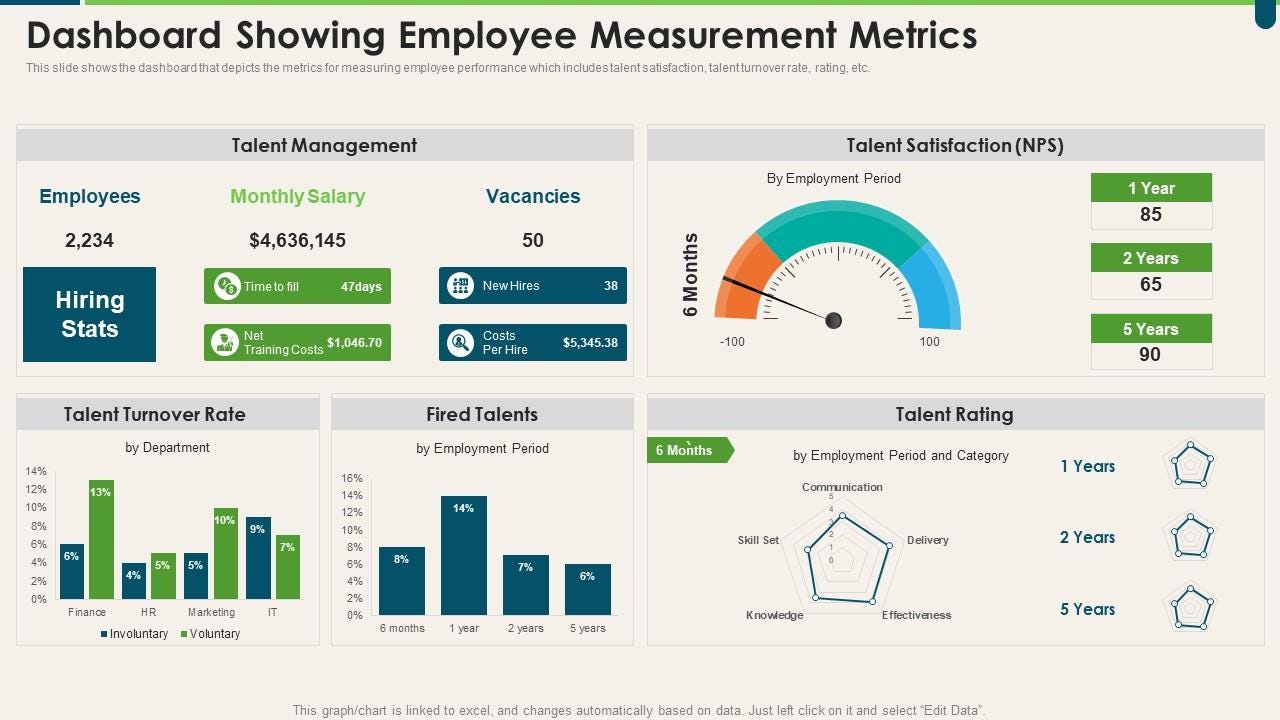
You can check HR Analytics to analyze employee datalike tenure, performance, engagement scores, and salary. Guess what? You can even predict which employees are at high risk of leaving.
This helps HR take proactive steps to retain key talent before they decide to leave. For example – by offering career development opportunities, increasing engagement efforts, and many others.
By checking the historical recruitment data using HR Analytics, you can identify which job boards, recruitment agencies, or interview processes lead to the best hires. Explore this case study to discover how to improve HR operations using workforce analytics.
This way your HR manager can focus on the most effective recruitment sources while saving time and money. This eventually leads to positives in hiring better candidates.
Understanding engagement levels is crucial, especially across teams of different departments. HR managers can use employee survey data combined with performance reviews to learn this effectively.
If engagement is low in a certain area, HR can investigate the causes e.g., management issues or lack of recognition and implement targeted initiatives to improve satisfaction and productivity.
Check out these awesome case studies about employee engagement! They show how different organizations made it work really well for their teams.
HR can identify trends that indicate which departments or teams are most productive by analysing data from time-tracking software, performance reviews, and employee output.
HR can then use these insights to replicate successful strategies or intervene with teams that need additional support or resources.
Build low code apps with a top-class Power Apps Consulting Company
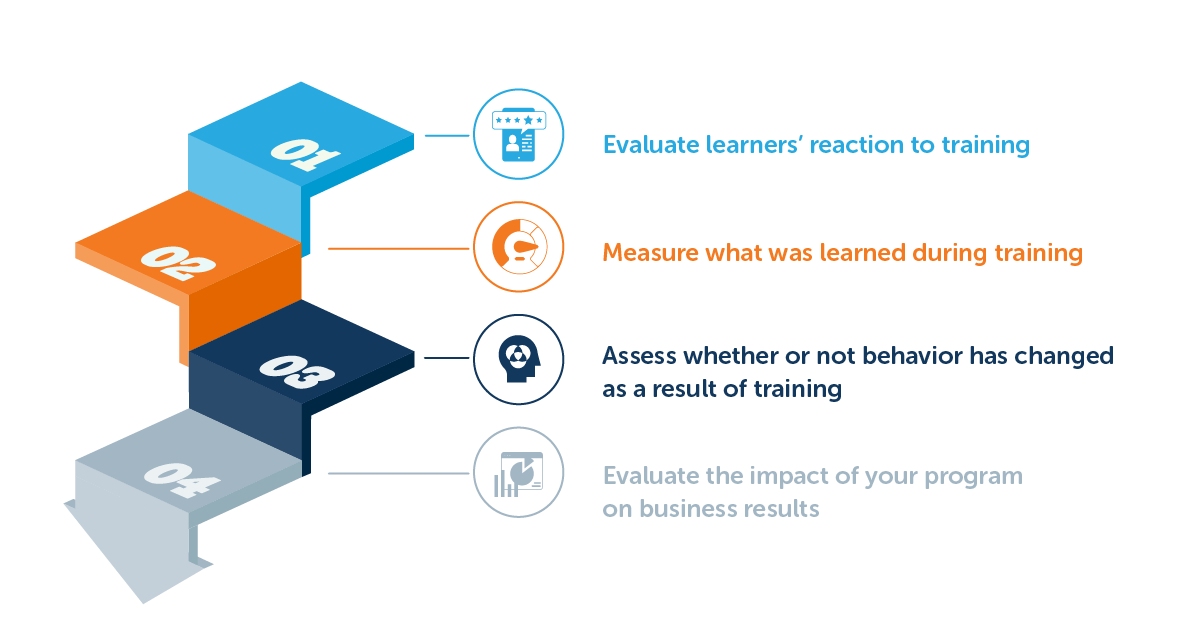
Data on training completion rates, assessment scores, and performance improvements help HR determine the ROI of development programs.
These actionable insights help you optimize your training initiativeseventually leading to better performance and employee satisfaction.
HR Analytics analyzes historical scheduling data to optimize staffing levels. For example, it might identify patterns like certain departments being overstaffed during slow periods or understaffed during busy times, allowing HR to adjust schedules and improve overall efficiency.
These examples show how HR analytics can drive smarter decisions and foster a productive, engaged workforce. We hope you found this article informative and helpful.
HR is all about people, and implementing HR Analytics dashboards can significantly enhance your firm’s efficacy, making it smarter and more reliant on data. By monitoring key performance indicators (KPIs) through these Power BI dashboards, you can solve resource-related issues and promote a positive work culture.
In this blog, we discussed key metrics and examples of HR analytics. We also explored some of the top case studies in HR analytics to show how the HR department uses data visualization.
Looking to build a custom HR analytics dashboard? Let’s connect and discuss what you’re looking for. With our professional Power BI consulting services, we’ll assist you in creating custom HR analytics dashboards that function smoothly.
HR analytics helps you make better decisions about your employees. By looking at data on things like performance, engagement, and turnover, you can spot trends and areas that need improvement. This means you can come up with strategies to keep your best people, boost productivity, and make sure your team is working towards your business goals.
Analytics is all about digging into data to find patterns and insights that help you make decisions. KPIs (Key Performance Indicators) are specific metrics you track to see how well you're doing against your goals. So, think of analytics as the process and KPIs as the specific things you measure within that process.
Analytics is the broader practice of analyzing data to gain insights and make decisions. CPI (Consumer Price Index) is a specific measure that tracks changes in the price level of a basket of consumer goods and services over time. Basically, CPI is one type of data you might analyze, while analytics is the method you use to understand and interpret that data.
Build Your Agile Team
It’s difficult to believe, but there are about 426 Business Intelligence tools available! And the leaders in this field are Tableau, holding a 12.37% market share, and Power BI, which...
Choosing between Databricks and Azure Synapse Analytics can feel like picking between two powerful data analytics tools, each with its own strengths and unique features. Azure Synapse...
Let's rewind to the 1990s. Data used to be stored on servers and CEOs relied on basic tools to make optimal decisions. No dashboards, nothing. When you use Power BI with a solid...