×

iFour Logo

10 Executive Dashboard Examples for Consultants and CEOs

Kapil Panchal - December 12, 2024

Listening is fun too.

Straighten your back and cherish with coffee - PLAY !
  • play
  • pause
  • pause
10 Executive Dashboard Examples for Consultants and CEOs

There is a principle behind every business. “If you don’t keep track of essentials, you won’t get clear direction, eventually causing your company to stumble.” To manage this scenario, the use of an executive dashboard is necessary.

Executive dashboards help you keep track of everything with an at-a-glance view, from team performance to business progress. It comes in various forms, each designed to show KPIs (key performance indicators) graphically, making sense of large data sets.

This can be employed in any sector, be it healthcare, banking, or legal, to support better decision-making.

In this blog, we will look at the best executive dashboard examples that CEOs and consultants should know.

Top Examples of Executive Dashboards for Consultants and CEOs

A well-designed executive dashboard helps leaders see the big picture and keeps everyone accountable and responsive, whether in healthcare, legal, or fintech. Let’s look at the examples of Executive dashboards and how each one plays a pivotal role in improving business decisions.

1) CEO Dashboard

A CEO dashboard is an important tool that provides a quick overview of a company’s performance and key metrics. It consolidates important data from various departments, allowing the CEO to see how the business is doing briefly. This dashboard typically includes information on financial performance, sales figures, operational efficiency, and customer satisfaction. By having all this data in one place, CEOs can make informed decisions and adjust strategies as needed.

Key metrics on a CEO dashboard often include

  • Revenue growth
  • Profit margins
  • Cash flow and
  • Employee performance.

Additionally, it may track customer retention rates and market trends.

These metrics help CEOs understand both the current state of the business and areas that need attention.

Hire Power BI developers to simplify your data journey!

2) Management Dashboard

A management dashboard is a lifeboat for business managers which helps them track and evaluate the performance of their teams and ongoing projects. What it does is it gathers all that critical data from different sources, organizes it and presents it in a simple and easy-to-understand format. This makes it much easier for managers to monitor progress and identify issues involved.

This dashboard provides a snapshot of key activities and outcomes, allowing managers to make informed decisions and keep their teams aligned with business goals.

Key metrics of a management dashboard typically include

  • Project timelines
  • Team productivity
  • Budget adherence and
  • Quality of work

Additionally, it may show customer feedback, employee engagement scores, and operational efficiency.

Focusing on these vital metrics allows managers to quickly learn how well their teams are performing and where improvements are required. This approach helps the company drive better results keeping an eye on consistency.

3) Financial Dashboard

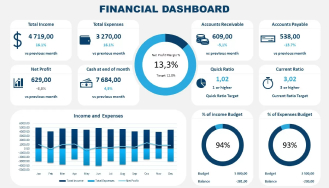
A financial dashboard is yet another most-used Executive dashboard example and an important part of data analytics that gives companies a clear overview of their financial health. And how does this work? By gathering critical financial data and presenting it in an easy-to-read format which helps business leaders understand how their organization is performing financially.

This dashboard can track various aspects of the business’s finances, such as revenue, expenses, and profit margins, allowing for quick assessments and timely decision-making.

Key metrics on a financial dashboard often include

  • Total revenue,
  • Net profit,
  • Cash flow, and
  • Operating expenses.

It may also show financial ratios like return on investment (ROI) and debt-to-equity ratio.

By monitoring these metrics, business leaders can identify trends, manage budgets more effectively, and ensure that the company remains on a solid financial footing.

Overall, a financial dashboard serves an essential role in a business that uses advanced data analytics tools to achieve financial transparency and success.

4) KPI Dashboard

A KPI dashboard is an essential tool that helps you track key performance indicators (KPIs) in real time. KPIs are basically metrics that reflect how well your company is achieving its goals. The dashboard presents these indicators in an easy-to-understand format, allowing managers and teams to quickly assess their performance and make informed decisions based on the data.

Key metrics on a KPI dashboard can vary depending on the organization's objectives but often include -

  • Sales targets
  • Customer satisfaction scores
  • Employee productivity rates
  • Project completion timelines

By monitoring these metrics, teams can identify areas that need improvement and celebrate successes.x

Boost productivity with expert Power Automate consulting services

Overall, a KPI dashboard serves as a crucial tool for ensuring that everyone in the organization stays focused on achieving their goals and driving success.

5) Executive Reporting

Executive reporting is the process of presenting key information and data to senior leaders within an organization. This type of reporting provides a comprehensive overview of the company’s performance, challenges, and opportunities. It helps executives make strategic decisions by summarizing important insights from various departments, such as finance, sales, and operations, clearly and concisely.

Key metrics in executive reporting often include

  • Overall revenue
  • Profit margins
  • Market share
  • Customer retention rates.

Additionally, it may highlight performance against strategic goals, budget variances, and upcoming risks.

With all these critical metrics in focus, executive reports enable leaders to understand the firm’s current state and plan for future growth, ensuring that everyone is aligned and working toward common objectives.

6) Revenue Dashboard

Revenue dashboard helps executives track and analyze their income over time. Providing a clear overview of their spending, this dashboard helps them learn how much money the company is making from sales and other sources.

With such simplified data display executives can quickly assess their financial performance and make informed decisions about growth and investment.

Key metrics on a revenue dashboard often include

  • Total revenue
  • Revenue growth rate
  • Sales by product or region

In addition, it could also show recurring revenue, customer acquisition costs, and average deal size.

By monitoring these fintech metrics, CTOs can identify trends, optimize their sales strategies, and ensure they are on track to meet their financial goals.

Overall, a revenue dashboard is essential for understanding the company’s financial health and guiding future strategies.

7) Cash Flow Dashboard

A cash flow dashboard is another tremendous example for Executive Dashboards visual tool that helps businesses monitor the movement of cash in and out of the company. It provides a clear picture of how much cash is available at any given time, allowing leaders to understand their liquidity and make informed financial decisions.

By tracking cash flow, companies can ensure they have enough funds to cover expenses, invest in opportunities, and plan for future needs.

Key metrics on a cash flow dashboard often include

  • Total cash inflows
  • Total cash outflows
  • Net cash flow.

It may also show cash flow forecasts, which help predict future cash positions based on expected revenues and expenses.

Achieve seamless integration through expert Power Platform consulting

By keeping an eye on these metrics, businesses can manage their cash effectively, avoid cash shortages, and maintain financial stability. Overall, a cash flow dashboard is essential for healthy financial management and long-term success.

8) COO Dashboard

A COO dashboard is another executive dashboard example designed for the Chief Operating Officer (COO) to monitor and assess the company’s operational performance. It provides a comprehensive overview of key metrics related to the efficiency and effectiveness of daily operations. By presenting this information in an accessible format, the COO can quickly identify areas that are performing well and those that need improvement, facilitating better decision-making.

Key metrics on a COO dashboard often include

  • Operational efficiency
  • Production costs
  • Employee productivity, and
  • Customer satisfaction ratings.

It may also track supply chain performance, project timelines, and resource allocation.

These metrics when focused keenly help the COO ensure everything in the business runs smoothly and meets its strategic goals.

Overall, a COO dashboard is essential for maintaining operational excellence and driving continuous improvement within the company.

9) CFO Dashboard

A CFO dashboard is yet another data visualization dashboard that helps CFOs (Chief Financial Officers) monitor their company’s financial health. It gives a clear and concise view of key financial data, allowing the CFO to make informed decisions about budgeting, investments, and overall financial strategy.

By using this dashboard, the CFO can quickly assess how the company is performing and identify any potential financial issues.

Key metrics on a CFO dashboard often include

  • Total revenue
  • Expenses
  • Profit margins
  • Cash flow
  • Financial ratios like return on investment (ROI).

It may also track forecasts and variances against the budget.

By keeping all these metrics in focus, the CFO can ensure that the firm is on track to meet its financial goals and can respond proactively to any challenges that arise.

Overall, a CFO dashboard is crucial for effective financial management and strategic planning.

Build cross-platform apps with the best Power Apps consulting company

10) Performance Management Dashboard

A performance management dashboard is an excellent example of an executive dashboard that helps organizations track and evaluate employee and team performance. It provides a comprehensive overview of key performance indicators (KPIs) that measure how well individuals and teams are meeting their goals. By displaying this information in a clear format, managers can easily assess strengths and areas for improvement, facilitating ongoing development and accountability.

Key metrics on a performance management dashboard often include

  • Individual employee goals
  • Team productivity levels
  • Training and development progress
  • Employee engagement scores.

It may also highlight performance trends over time and compare results against benchmarks.

Monitoring these metrics effectively would help companies foster a culture of continuous improvement, motivate employees, and ensure that everyone is aligned with the company’s objectives.

Overall, a performance management dashboard is essential for driving employee success and organizational growth.

So, these are the top Executive dashboard examples that help you visualize actionable KPIs. We hope you found this useful and assist you in various aspects of your business.

Executive Dashboard Examples – Wrapping Up

In conclusion, leveraging various dashboards such as CEO, management, financial, KPI, executive, revenue, cash flow, COO, CFO, and performance management dashboards—can significantly enhance decision-making and operational efficiency within an organization. Each dashboard serves a unique purpose, providing critical insights that empower leaders to track performance, identify trends, and make informed choices that align with strategic goals.

Want to build industry-specific custom dashboards for quick decision-making? We’ve got you covered! Partner with iFour – a leading Power BI consulting company and get your work done!

FAQ on Examples of Executive Dashboards

1) What are the three types of dashboards?

The three types of dashboards are operational dashboards, analytical dashboards, and strategic dashboards.

2) Which dashboard is used by executives?

Executives typically use executive dashboards to monitor overall performance and key metrics.

3) What to include on a CEO dashboard?

A CEO dashboard should include metrics like revenue, profit margins, key performance indicators, and market trends.

4) How to build an executive dashboard?

To build an executive dashboard, define key metrics, gather relevant data, and use visual tools to present the information clearly.

5) What are KPI dashboards?

KPI dashboards are tools that display key performance indicators to track an organization’s performance and progress toward goals.

10 Executive Dashboard Examples for Consultants and CEOs There is a principle behind every business. “If you don’t keep track of essentials, you won’t get clear direction, eventually causing your company to stumble.” To manage this scenario, the use of an executive dashboard is necessary. Executive dashboards help you keep track of everything with an at-a-glance view, from team performance to business progress. It comes in various forms, each designed to show KPIs (key performance indicators) graphically, making sense of large data sets. This can be employed in any sector, be it healthcare, banking, or legal, to support better decision-making. In this blog, we will look at the best executive dashboard examples that CEOs and consultants should know. Top Examples of Executive Dashboards for Consultants and CEOs A well-designed executive dashboard helps leaders see the big picture and keeps everyone accountable and responsive, whether in healthcare, legal, or fintech. Let’s look at the examples of Executive dashboards and how each one plays a pivotal role in improving business decisions. 1) CEO Dashboard A CEO dashboard is an important tool that provides a quick overview of a company’s performance and key metrics. It consolidates important data from various departments, allowing the CEO to see how the business is doing briefly. This dashboard typically includes information on financial performance, sales figures, operational efficiency, and customer satisfaction. By having all this data in one place, CEOs can make informed decisions and adjust strategies as needed. Key metrics on a CEO dashboard often include Revenue growth Profit margins Cash flow and Employee performance. Additionally, it may track customer retention rates and market trends. These metrics help CEOs understand both the current state of the business and areas that need attention. Hire Power BI developers to simplify your data journey! Get started now 2) Management Dashboard A management dashboard is a lifeboat for business managers which helps them track and evaluate the performance of their teams and ongoing projects. What it does is it gathers all that critical data from different sources, organizes it and presents it in a simple and easy-to-understand format. This makes it much easier for managers to monitor progress and identify issues involved. This dashboard provides a snapshot of key activities and outcomes, allowing managers to make informed decisions and keep their teams aligned with business goals. Key metrics of a management dashboard typically include Project timelines Team productivity Budget adherence and Quality of work Additionally, it may show customer feedback, employee engagement scores, and operational efficiency. Focusing on these vital metrics allows managers to quickly learn how well their teams are performing and where improvements are required. This approach helps the company drive better results keeping an eye on consistency. Read More: 19 Power BI Case Studies That Showcase Real-World Success 3) Financial Dashboard A financial dashboard is yet another most-used Executive dashboard example and an important part of data analytics that gives companies a clear overview of their financial health. And how does this work? By gathering critical financial data and presenting it in an easy-to-read format which helps business leaders understand how their organization is performing financially. This dashboard can track various aspects of the business’s finances, such as revenue, expenses, and profit margins, allowing for quick assessments and timely decision-making. Key metrics on a financial dashboard often include Total revenue, Net profit, Cash flow, and Operating expenses. It may also show financial ratios like return on investment (ROI) and debt-to-equity ratio. By monitoring these metrics, business leaders can identify trends, manage budgets more effectively, and ensure that the company remains on a solid financial footing. Overall, a financial dashboard serves an essential role in a business that uses advanced data analytics tools to achieve financial transparency and success. 4) KPI Dashboard A KPI dashboard is an essential tool that helps you track key performance indicators (KPIs) in real time. KPIs are basically metrics that reflect how well your company is achieving its goals. The dashboard presents these indicators in an easy-to-understand format, allowing managers and teams to quickly assess their performance and make informed decisions based on the data. Key metrics on a KPI dashboard can vary depending on the organization's objectives but often include - Sales targets Customer satisfaction scores Employee productivity rates Project completion timelines By monitoring these metrics, teams can identify areas that need improvement and celebrate successes.x Boost productivity with expert Power Automate consulting services Automate Now Overall, a KPI dashboard serves as a crucial tool for ensuring that everyone in the organization stays focused on achieving their goals and driving success. 5) Executive Reporting Executive reporting is the process of presenting key information and data to senior leaders within an organization. This type of reporting provides a comprehensive overview of the company’s performance, challenges, and opportunities. It helps executives make strategic decisions by summarizing important insights from various departments, such as finance, sales, and operations, clearly and concisely. Key metrics in executive reporting often include Overall revenue Profit margins Market share Customer retention rates. Additionally, it may highlight performance against strategic goals, budget variances, and upcoming risks. With all these critical metrics in focus, executive reports enable leaders to understand the firm’s current state and plan for future growth, ensuring that everyone is aligned and working toward common objectives. 6) Revenue Dashboard Revenue dashboard helps executives track and analyze their income over time. Providing a clear overview of their spending, this dashboard helps them learn how much money the company is making from sales and other sources. With such simplified data display executives can quickly assess their financial performance and make informed decisions about growth and investment. Read More: Power BI Forecasting Challenges and Solutions Key metrics on a revenue dashboard often include Total revenue Revenue growth rate Sales by product or region In addition, it could also show recurring revenue, customer acquisition costs, and average deal size. By monitoring these fintech metrics, CTOs can identify trends, optimize their sales strategies, and ensure they are on track to meet their financial goals. Overall, a revenue dashboard is essential for understanding the company’s financial health and guiding future strategies. 7) Cash Flow Dashboard A cash flow dashboard is another tremendous example for Executive Dashboards visual tool that helps businesses monitor the movement of cash in and out of the company. It provides a clear picture of how much cash is available at any given time, allowing leaders to understand their liquidity and make informed financial decisions. By tracking cash flow, companies can ensure they have enough funds to cover expenses, invest in opportunities, and plan for future needs. Key metrics on a cash flow dashboard often include Total cash inflows Total cash outflows Net cash flow. It may also show cash flow forecasts, which help predict future cash positions based on expected revenues and expenses. Achieve seamless integration through expert Power Platform consulting Connect now By keeping an eye on these metrics, businesses can manage their cash effectively, avoid cash shortages, and maintain financial stability. Overall, a cash flow dashboard is essential for healthy financial management and long-term success. 8) COO Dashboard A COO dashboard is another executive dashboard example designed for the Chief Operating Officer (COO) to monitor and assess the company’s operational performance. It provides a comprehensive overview of key metrics related to the efficiency and effectiveness of daily operations. By presenting this information in an accessible format, the COO can quickly identify areas that are performing well and those that need improvement, facilitating better decision-making. Key metrics on a COO dashboard often include Operational efficiency Production costs Employee productivity, and Customer satisfaction ratings. It may also track supply chain performance, project timelines, and resource allocation. These metrics when focused keenly help the COO ensure everything in the business runs smoothly and meets its strategic goals. Read More: How to Automate Power BI Reports Using Power Automate Overall, a COO dashboard is essential for maintaining operational excellence and driving continuous improvement within the company. 9) CFO Dashboard A CFO dashboard is yet another data visualization dashboard that helps CFOs (Chief Financial Officers) monitor their company’s financial health. It gives a clear and concise view of key financial data, allowing the CFO to make informed decisions about budgeting, investments, and overall financial strategy. By using this dashboard, the CFO can quickly assess how the company is performing and identify any potential financial issues. Key metrics on a CFO dashboard often include Total revenue Expenses Profit margins Cash flow Financial ratios like return on investment (ROI). It may also track forecasts and variances against the budget. By keeping all these metrics in focus, the CFO can ensure that the firm is on track to meet its financial goals and can respond proactively to any challenges that arise. Overall, a CFO dashboard is crucial for effective financial management and strategic planning. Build cross-platform apps with the best Power Apps consulting company Get Started Now 10) Performance Management Dashboard A performance management dashboard is an excellent example of an executive dashboard that helps organizations track and evaluate employee and team performance. It provides a comprehensive overview of key performance indicators (KPIs) that measure how well individuals and teams are meeting their goals. By displaying this information in a clear format, managers can easily assess strengths and areas for improvement, facilitating ongoing development and accountability. Key metrics on a performance management dashboard often include Individual employee goals Team productivity levels Training and development progress Employee engagement scores. It may also highlight performance trends over time and compare results against benchmarks. Monitoring these metrics effectively would help companies foster a culture of continuous improvement, motivate employees, and ensure that everyone is aligned with the company’s objectives. Read More: Tableau to Power BI Migration – A Comprehensive Guide Overall, a performance management dashboard is essential for driving employee success and organizational growth. So, these are the top Executive dashboard examples that help you visualize actionable KPIs. We hope you found this useful and assist you in various aspects of your business. Executive Dashboard Examples – Wrapping Up In conclusion, leveraging various dashboards such as CEO, management, financial, KPI, executive, revenue, cash flow, COO, CFO, and performance management dashboards—can significantly enhance decision-making and operational efficiency within an organization. Each dashboard serves a unique purpose, providing critical insights that empower leaders to track performance, identify trends, and make informed choices that align with strategic goals. Want to build industry-specific custom dashboards for quick decision-making? We’ve got you covered! Partner with iFour – a leading Power BI consulting company and get your work done! FAQ on Examples of Executive Dashboards 1) What are the three types of dashboards? The three types of dashboards are operational dashboards, analytical dashboards, and strategic dashboards. 2) Which dashboard is used by executives? Executives typically use executive dashboards to monitor overall performance and key metrics. 3) What to include on a CEO dashboard? A CEO dashboard should include metrics like revenue, profit margins, key performance indicators, and market trends. 4) How to build an executive dashboard? To build an executive dashboard, define key metrics, gather relevant data, and use visual tools to present the information clearly. 5) What are KPI dashboards? KPI dashboards are tools that display key performance indicators to track an organization’s performance and progress toward goals.
Kapil Panchal

Kapil Panchal

A passionate Technical writer and an SEO freak working as a Content Development Manager at iFour Technolab, USA. With extensive experience in IT, Services, and Product sectors, I relish writing about technology and love sharing exceptional insights on various platforms. I believe in constant learning and am passionate about being better every day.

Build Your Agile Team

Enter your e-mail address Please enter valid e-mail

Categories

Ensure your sustainable growth with our team

Talk to our experts
Sustainable
Sustainable
 
Blog Our insights
UWP vs WPF - Key Differences Explained!

Several experts, particularly those just starting out, often find themselves confused about WPF and UWP, wondering if they are the same. Since they are used to create great UIs for...

Top Desktop Automation Tools for Desktop Applications

Desktop application – this solution reminds me of those frustrating times when I use to stare at the screen wishing for better way of managing my routines to focus on what truly matters. Today,...

WPF vs MAUI: Key Differences that Businesses Should Know

We have all heard about the strength of Microsoft frameworks and how they're ideal for bespoke software development. Don’t we? We're also aware of its inclusive ecosystem and how it supports technologies for developing cross-platform projects for Windows, macOS, iOS, Android, and Linux.