





























































How to Use Power BI for Sales Forecasting (Guide for CTOs)
The most successful companies don't just study the past. They prepare for the future. But how do they do that? Well, for many of them, the answer starts with Microsoft Power...


601 & 612, The Times square Arcade, Near Baghban party plot, Thaltej - Shilaj Road, Thaltej, Ahmedabad, Gujarat - 380059
Listening is fun too.
Straighten your back and cherish with coffee - PLAY !
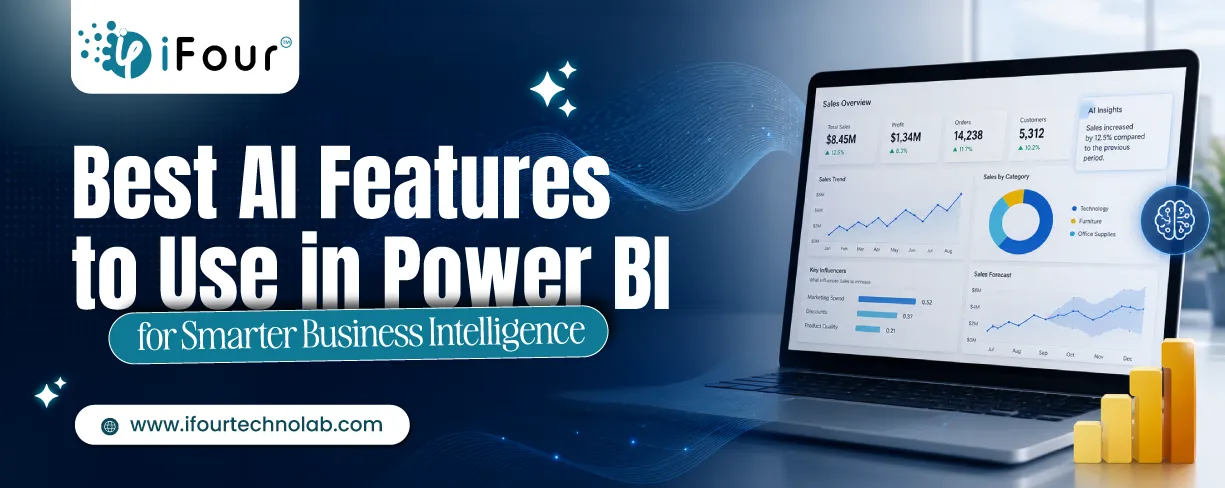
Quick Summary:
Power BI uses AI to automatically point out patterns, identify anomalies, and create forecasts, providing analysts and executives with the insights necessary to make confident and swift decisions.
Capabilities like Copilot, AI Visuals, Key Influencers, Smart Narratives, Decomposition Tree, and AI visuals make advanced analytics more accessible to non-technical users.
Applications of AI in Power BI include sales forecasting, operations supervision, customer segmentation, financial analysis, supply chain optimization, and executive reporting.
Power BI is trusted by around 375,000 organizations worldwide. While adoption is strong, the real business value comes when companies tap into its advanced AI features, including anomaly detection, predictive forecasting, Key Influencers, Smart Narrative, and Copilot.
But this naturally raises a question many BI consultants ask: How does Power BI use AI to make reports easier? The answer lies in its ability to automate visual creation, generate natural-language summaries, and support conversational querying. These capabilities simplify reporting, minimize manual effort, and empower decision-makers to interact with data in a more intuitive and effective way.
In this guide, we will explore the most impactful AI features available in Power BI, see how they work, understand the practical business applications, and determine which AI capabilities can deliver the greatest value for your business.
AI features in Power BI are built-in capabilities that use artificial intelligence and machine learning to automate data analysis, identify trends, detect anomalies, generate narratives, forecast outcomes, and answer business questions using natural language.
These features help you make faster, data-driven decisions without requiring to be a data analyst.
Machine learning integration enables predictive analytics.
Need assistance in making the most out of AI features of Power BI? Hire our BI developers right away.
You can use AI in Power BI through built-in Copilot, smart visuals, natural language queries, and key influencer features. It helps you automate analysis, forecast trends, and generate reports using natural language.
Traditional Power BI assists you in learning scenarios like:
AI-driven Power BI helps you go deeper into data and answer business-critical questions with speed and clarity. Like, for example:
Instead of manually analyzing hundreds of reports, Power BI's AI features automatically discover relationships, explain trends, and provide actionable recommendations.
Copilot for conversational text prompts
Key Influencers for driving metrics
Decomposition Trees for root-cause lookups
Anomaly Detection for outliers and
Smart Narratives for auto-text summaries.
Expert quote on "How AI + Power BI helps":
"Enterprises often invest in BI platforms but continue relying on manual reporting. If they use Power BI's AI capabilities effectively, they can easily shift from descriptive reporting to predictive and prescriptive decision-making."
— Vinod Satapara, CTO & Microsoft Power Platform Consultant
You can use AI in Power BI by enabling Copilot and other AI-infused features. This way, you can move from static reporting into predictive, prescriptive, and conversational insights.
Here are the best AI features available in Power BI:
What does Power BI Copilot do?
Microsoft Copilot helps users create reports, summarize insights, write DAX queries, and interact with data using natural language.
Instead of manually building visualizations, users can simply type prompts such as:
Copilot generates appropriate charts, summaries, and visualizations automatically using Generative AI.
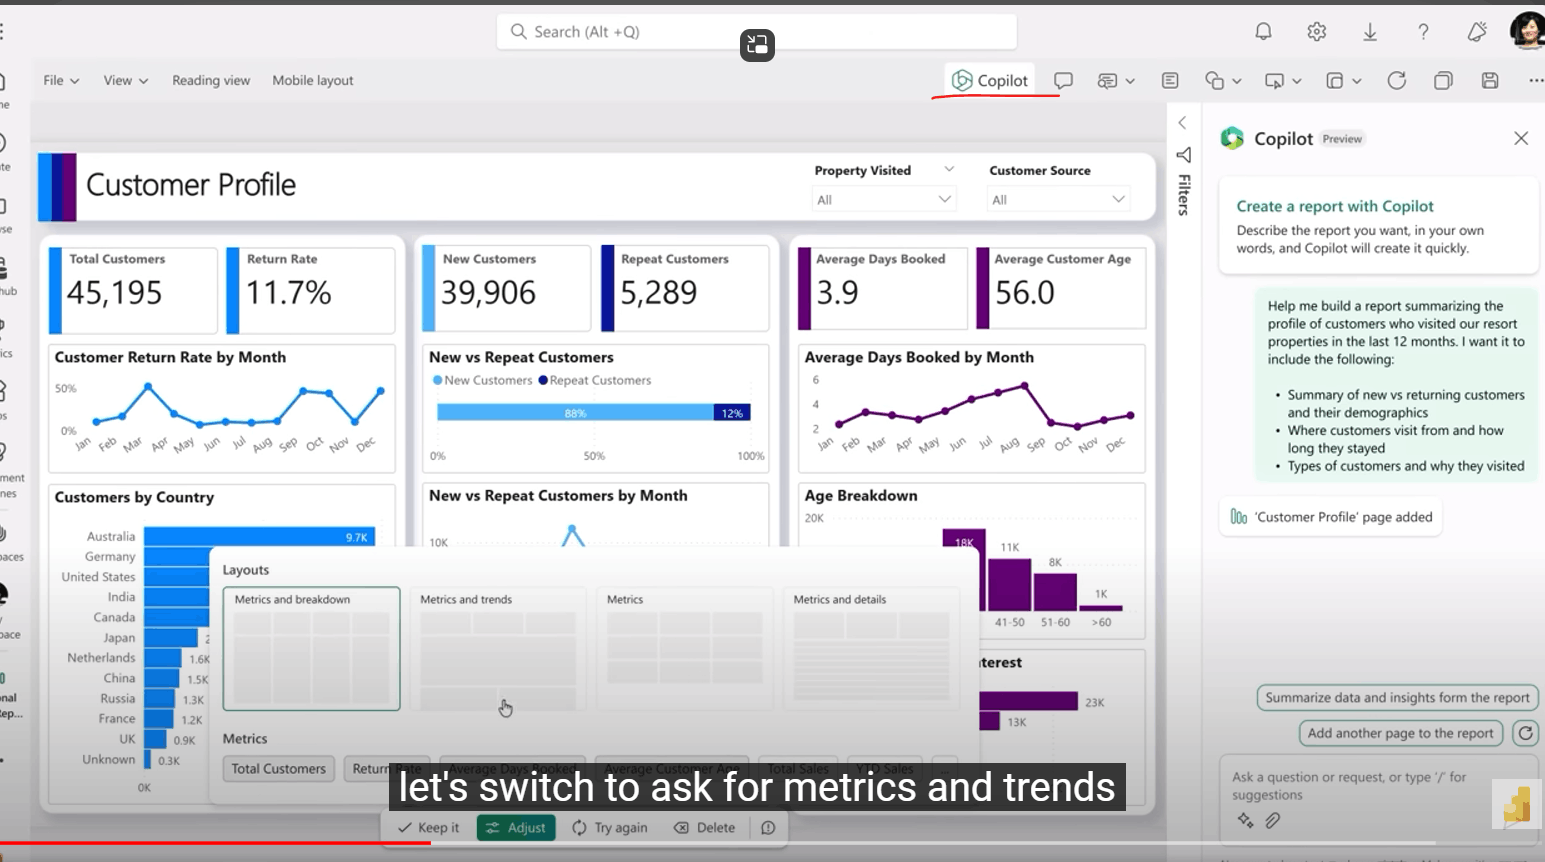
Most business users face challenges in creating reports due to limited Power BI expertise. This is where Copilot helps by lowering the learning curve, enabling non-technical users to generate meaningful reports quickly.
See this Power BI Copilot Tutorial that solves #1 problem.
A retail manager wants to understand declining sales across multiple stores. Instead of manually creating filters and charts, they ask Copilot:
"Why did sales decrease in the South region during Q2?"
Copilot analyzes available data and generates insights highlighting reduced foot traffic, seasonal demand shifts, and lower-performing product categories.
If you want to know why your BI forecasts don't match real-world outcomes, explore this: Power BI forecasting accuracy issues solved
Not sure how to migrate your reports?
Figure it out with our Power BI Migration Services
What is Smart Narrative?
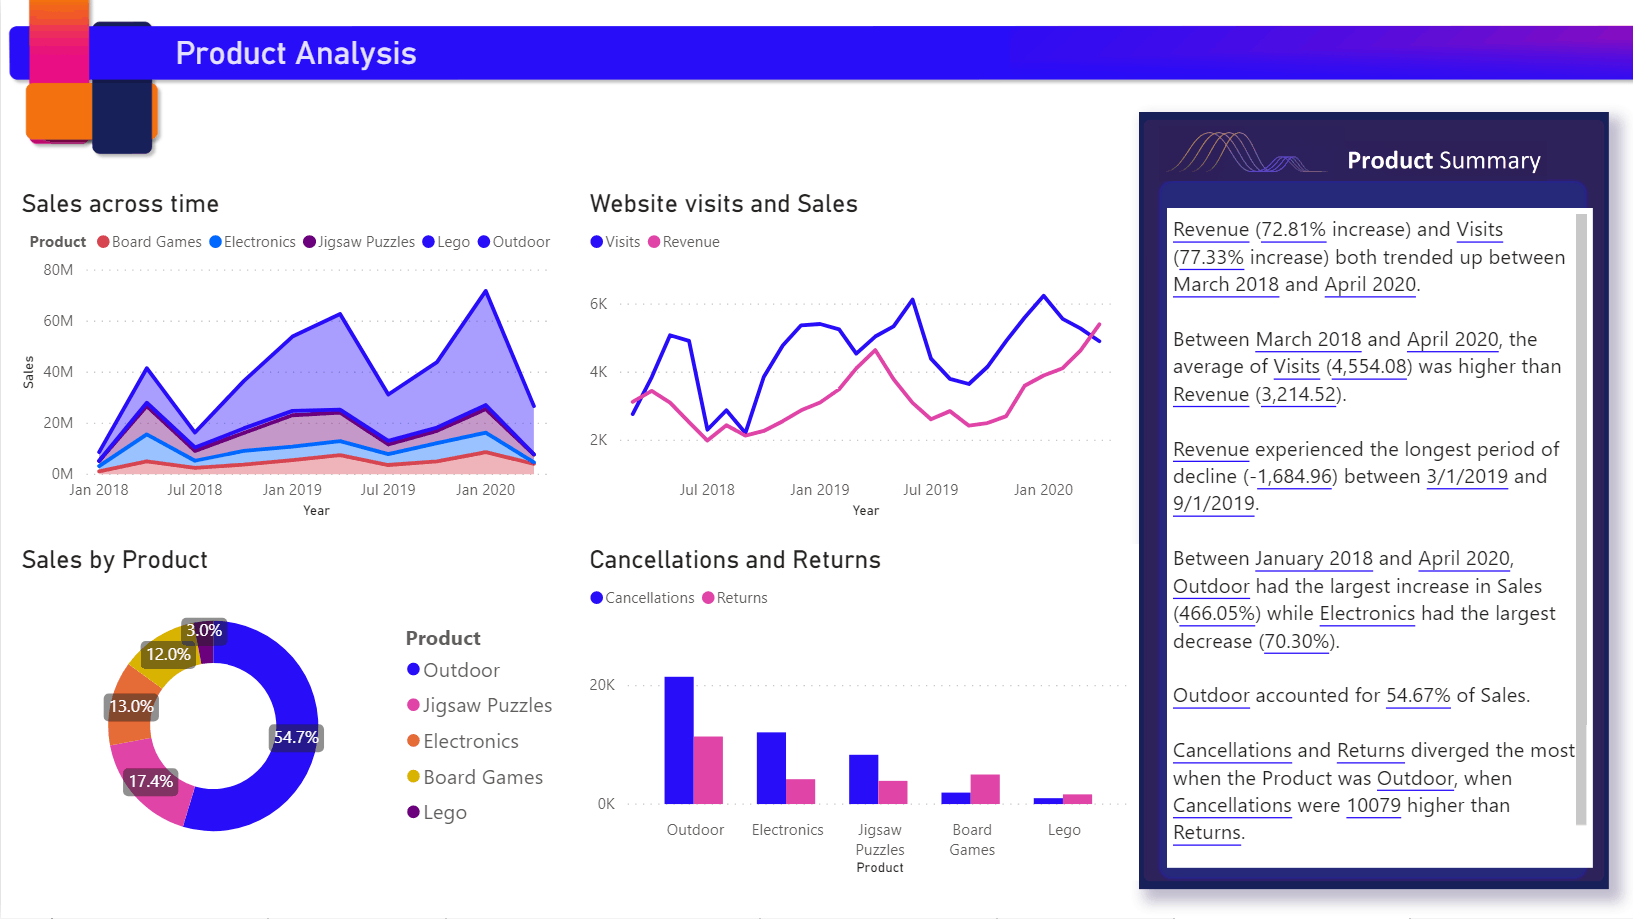
Smart Narrative automatically converts charts and reports into easy-to-understand written summaries.
Rather than interpreting multiple visuals individually, users receive AI-generated explanations describing significant trends and performance metrics.
Smart Narrative Visual Example
Instead of reviewing multiple sales charts, Smart Narrative may generate:
"Total revenue increased by 18% compared to the previous quarter, primarily driven by higher online sales in the Western region."
This significantly improves executive reporting.
Why Businesses Use Smart Narrative?
CTOs often prefer concise summaries rather than complex dashboards. Smart Narrative bridges the gap between analytics and business communication.
Top Use Cases of Smart Narrative Visual in Power BI
Check this out to learn how to create dashboard using AI in Power BI.
Load your BI data 89% faster
Download & see the hidden Power BI Performance best practices
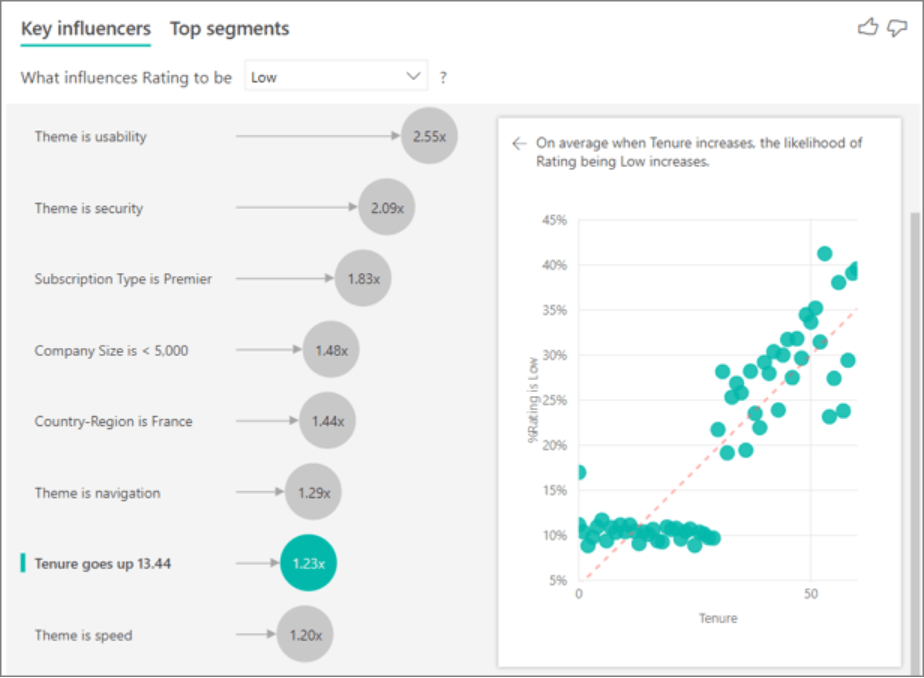
Key Influencers identifies which factors have the greatest impact on a specific business outcome.
Instead of manually testing variables, Power BI automatically analyzes relationships within the dataset.
How Key Inflencers in Power BI helps? (Example scenario)
A healthcare firm wants to understand why patient satisfaction scores have declined.
Power BI identifies key influencing factors such as:
This enables leadership to prioritize operational improvements based on data rather than assumptions.
Not sure how to use your healthcare data?
Figure it out with our Healthcare Analytics Services
Benefits of Key Influencers Visual in Power BI
Limitations of Key Influencers Visual
What is AI-powered Forecasting?
AI-powered forecasting uses machine learning and data analysis to predict future outcomes like product demand, sales, or financial trends. It looks at huge amounts of past and live data—including weather, market shifts, and user habits—to spot hidden patterns and make exact predictions automatically.
For further context, see this: What is AI Demand Forecasting
Power BI Forecasting is particularly valuable for industries with seasonal trends or recurring business cycles.
Read More: How to Use Power BI for Sales Forecasting
Predictive Analytics with AI Example
An eCommerce company analyzes three years of sales data to forecast holiday demand.
The AI-powered forecast estimates a 22% increase in product demand during the festive season, allowing inventory teams to prepare in advance.
Common Applications of AI Forecasting services
Business Value
Organizations can proactively allocate resources instead of reacting to unexpected demand fluctuations.
What is Anomaly Detection in Power BI?
Anomaly Detection automatically identifies unusual patterns or unexpected changes in business data.
Rather than manually monitoring hundreds of KPIs, Power BI flags abnormal behavior for further investigation.
Best example of Power BI's Anomaly detection
A manufacturing company observes an unexpected spike in production defects.
Power BI highlights the anomaly and correlates it with equipment maintenance delays.
The operations team investigates immediately, reducing downtime and preventing further quality issues.
Not sure how to track executive KPIs?
Figure it out with our CEO Dashboard Development Services
Why It Matters?
Without AI, anomalies often remain unnoticed until they significantly impact business performance. Automated detection enables firms to respond proactively.
Best Use Cases of Power BI Anomaly Detection
What benefits do you get with Anomaly Detection in Power BI?
Power BI offers several AI-powered visuals that automatically identify relationships, trends, and outliers without requiring advanced statistical knowledge. These visuals help users move beyond static charts and uncover insights that may otherwise remain hidden.
Why AI Visuals Matter
Traditional charts display what happened. AI visuals explain why it happened by analyzing relationships across multiple dimensions.
Popular AI Visuals in Power BI
| AI Visual | Purpose | Best Used For |
|---|---|---|
| Key Influencers | Identifies factors driving outcomes | Customer churn, sales, profitability |
| Decomposition Tree | Performs guided root-cause analysis | Revenue decline, operational issues |
| Anomaly Detection | Finds unexpected patterns | Fraud detection, KPI monitoring |
| Smart Narrative | Generates automated summaries | Executive reporting |
How AI + Power BI helps? (Example scenario)
A telecom company notices a decline in customer renewals. Instead of manually filtering hundreds of variables, analysts use the Decomposition Tree to drill into region, customer age, subscription type, and support history. Within minutes, they identify that premium customers in one region experienced longer support response times—revealing the primary driver behind the churn.
Ajay Patel, CTO & Director at iFour says:
"AI visuals are most effective when combined with a well-designed semantic model. Ensure your data is clean, consistently categorized, and regularly refreshed to improve the quality of AI-generated insights."
What Is the Q&A Visual?
The Q&A Visual allows users to interact with reports using everyday language instead of building charts manually.
Users can type questions such as:
Power BI automatically interprets the request and generates the appropriate visualization.
Struggling to see sales clearly?
Figure it out with our Sales Dashboard Development Services
Why It Matters
Business users often depend on BI teams for even simple reporting requests. Natural Language Q&A empowers managers, executives, and non-technical stakeholders to retrieve insights independently.
Benefits of Q&A Visual in Power BI
Best Use Cases of Q&A Visual in Power BI
Limitations of Q&A Visuals
The feature performs best when the semantic model uses clear business-friendly names instead of technical database fields.
Power BI integrates with Azure AI services to analyze both structured and unstructured data without requiring custom machine learning models.
You can leverage pre-built AI capabilities such as:
Business Example of AI Azure Cognitive Services
An online retailer collects thousands of customer reviews every month.
Instead of manually reading each review, Power BI automatically classifies customer sentiment into positive, neutral, and negative categories.
Management quickly identifies recurring complaints related to delivery delays and product packaging, enabling faster corrective action.
Want to switch from Tableau to Power BI?
Figure it out with our Tableau to Power BI Migration Expertise
Business Value
Organizations can extract meaningful insights from customer feedback, surveys, support tickets, emails, and social media conversations.
Benefits of AI Insights using Azure Cognitive Services
What Is Azure Machine Learning Integration?
While Power BI includes several built-in AI capabilities, organizations with advanced analytical needs can connect Power BI to Azure Machine Learning models.
This enables businesses to display predictive insights directly within dashboards.
Common Applications of Azure ML Integration:
Example of Azure ML Integration
A financial institution develops an Azure Machine Learning model to predict loan defaults.
The prediction scores are displayed inside Power BI dashboards, allowing loan officers to assess applicant risk before approving applications.
Benefits of Azure ML Integration
Limitations of Azure Machine Learning Integration
Requires data science expertise for model development and ongoing maintenance.
What Is AI in Power Query?
Power Query isn't just for cleaning and transforming data anymore. It also offers AI-powered transformations that automate complex data preparation tasks.
Users can apply AI functions directly during data preparation without writing machine learning algorithms.
AI Capabilities Available in Power Query Are:
Why AI in Power Query Matters?
Preparing data often consumes a significant portion of analytics projects. AI-assisted transformations reduce manual effort and improve consistency.
Not sure how to make data-driven HR decisions?
Figure it out with our HR Analytics Services
Example of using AI Insights in Power Query
An insurance company imports thousands of customer claim descriptions.
Power Query automatically extracts keywords such as:
This structured information enables faster reporting and claim categorization.
Not every organization requires every AI capability. Selecting the right feature depends on your business objectives, data maturity, and analytical requirements.
| Business Goal | Recommended AI Feature |
|---|---|
| Executive reporting | Smart Narrative |
| Root cause analysis | Key Influencers, Decomposition Tree |
| Forecast future sales | Forecasting |
| Detect unusual activity | Anomaly Detection |
| Customer feedback analysis | Azure Cognitive Services |
| Predict customer behavior | Azure Machine Learning |
| Self-service reporting | Q&A Visual, Copilot |
| Automate report creation | Microsoft Copilot |
Implementing AI successfully requires more than enabling a feature. Consider these best practices:
1. Start with High-Quality Data
AI models rely on accurate, complete, and well-structured datasets. Remove duplicates, handle missing values, and establish consistent naming conventions before analysis.
2. Build a Strong Semantic Model
Organize tables, define relationships, and use business-friendly field names. A well-designed semantic model improves the accuracy of Copilot and Natural Language Q&A responses.
3. Match AI Features to Business Problems
Avoid adopting AI simply because it's available. Clearly define the business question you want to answer and select the AI capability that best addresses that need.
4. Validate AI-Generated Insights
AI should support—not replace—human judgment. Always verify recommendations against domain expertise and business context before acting on them.
5. Protect Sensitive Data
When using AI services, ensure compliance with organizational security policies and regulatory requirements. Apply appropriate governance, role-based access controls, and data classification standards.
Organizations that invest in data governance and user training typically realize greater value from Power BI's AI capabilities than those focusing solely on technology implementation. Let's connect and make the most out of Power BI AI features.
Many organizations struggle to realize the full value of AI in Power BI due to avoidable missteps. Watch out for these common pitfalls:
Avoiding these mistakes helps ensure that AI delivers actionable insights rather than confusion.
So, that's how augmented analytics emerges as a key driver for modern business intelligence, enabling users to generate insights through natural language queries and automated data exploration.
Hope you found this helpful. For more such insights, explore our Power BI blogs.
Artificial intelligence has fundamentally changed the way of interaction with business data. Instead of spending hours building reports or manually searching for trends, Power BI now enables users to:
However, implementing AI successfully isn't about enabling every available feature. It's about selecting the capabilities that align with your enterprise goals.
Whether you're looking to improve executive reporting with Smart Narrative, uncover root causes using Key Influencers, forecast demand with predictive analytics, or empower business users through Copilot, the true value of AI lies in transforming raw data into confident, actionable decisions.
As Microsoft continues to enhance Power BI with Copilot, Microsoft Fabric, and deeper AI integrations, organizations that invest in these capabilities today will be better positioned to make faster, smarter, and more informed business decisions tomorrow.
Need Expert Help with Power BI AI Implementation?
At iFour Technolab, we help organizations make the most out of Microsoft Power BI through:
Whether you're starting your analytics journey or modernizing an existing BI ecosystem, our Microsoft experts can help you build intelligent dashboards that drive measurable business outcomes.
Ready to transform your business with AI-powered analytics? Contact iFour Technolab today to discuss your Power BI implementation and see how intelligent insights can improvise your growth.
For beginners, Microsoft Copilot, Q&A Visual, and Smart Narrative provide the quickest value. They allow users to create reports, ask questions in natural language, and generate report summaries without learning advanced DAX or data modeling techniques.
No. Most built-in AI capabilities—including Key Influencers, Smart Narrative, Anomaly Detection, Forecasting, and Q&A Visual—can be used without writing code. However, integrating custom machine learning models through Azure Machine Learning may require data science expertise.
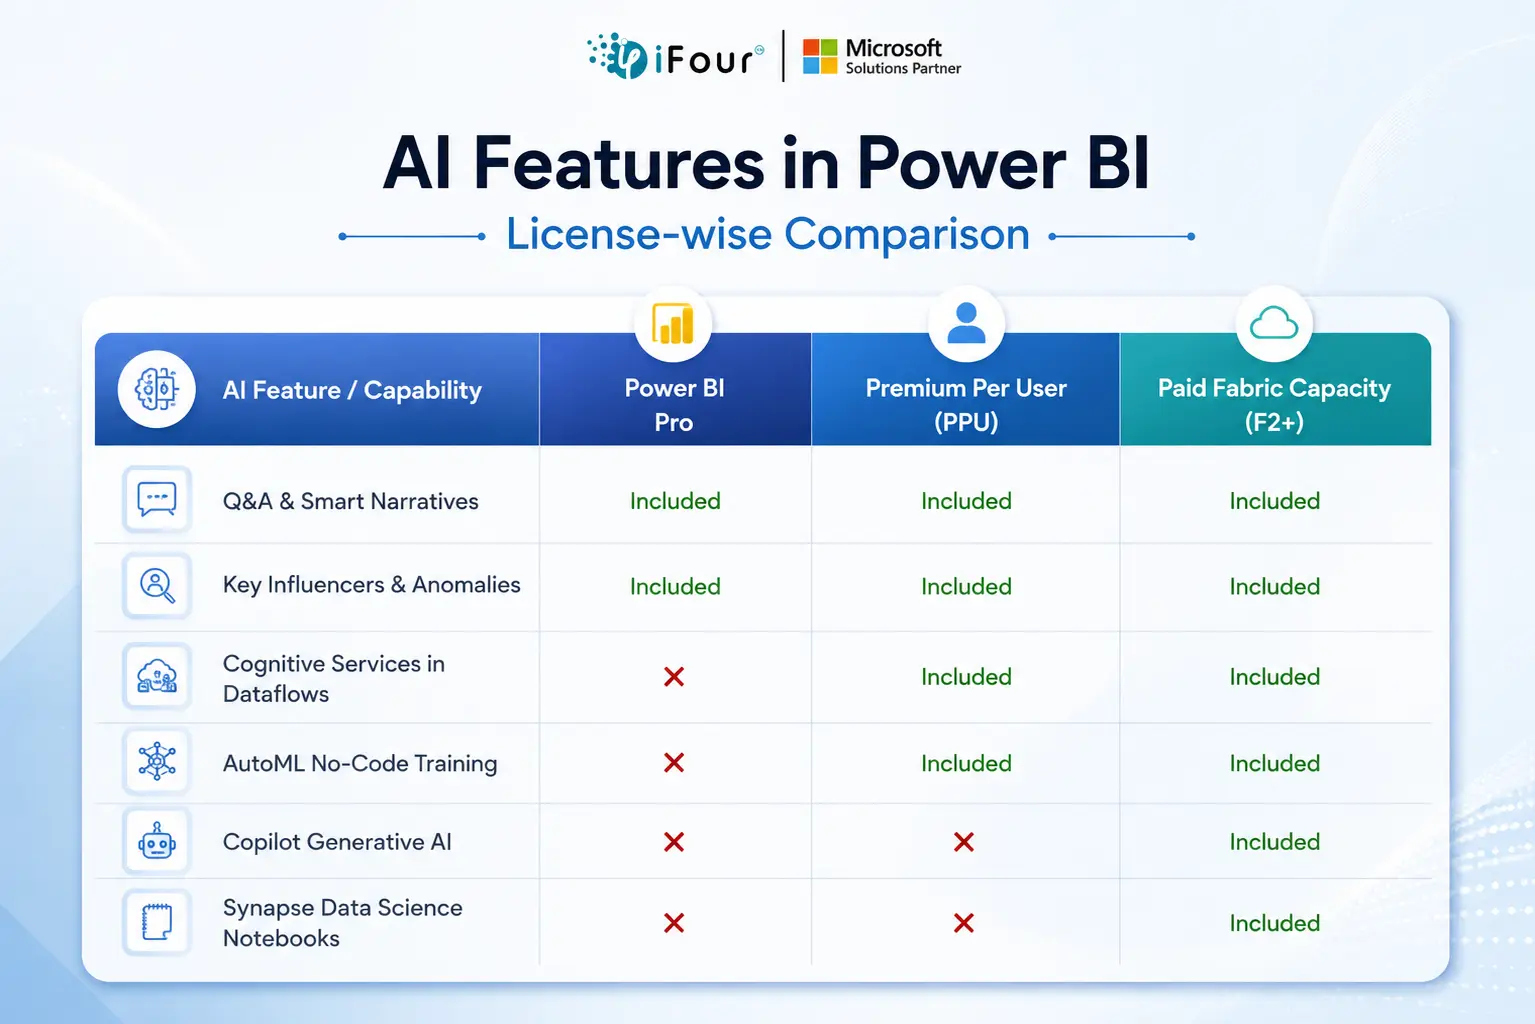
No. Copilot availability depends on your Microsoft licensing and whether your organization has adopted Microsoft Fabric and the required Power BI Premium or Fabric capacities. It's best to review the latest Microsoft licensing documentation before planning implementation.
Absolutely. Small and medium-sized businesses can use AI features to automate reporting, forecast sales, analyze customer feedback, monitor KPIs, and identify growth opportunities—without investing in complex data science infrastructure.
Power BI includes pre-built AI capabilities for business users, while Azure Machine Learning enables organizations to create, train, deploy, and integrate custom predictive models for advanced analytics scenarios.
Nearly every industry can leverage AI-powered analytics. Common examples include:
Healthcare: Patient outcome analysis and resource planning
Retail: Demand forecasting and inventory optimization
Finance: Fraud detection and risk assessment
Manufacturing: Predictive maintenance and quality control
Logistics: Supply chain optimization
Marketing: Campaign performance analysis and customer segmentation
Yes. Features like Smart Narrative, Copilot, and Q&A Visual automatically summarize key metrics and trends, allowing executives to understand business performance faster without manually interpreting multiple dashboards.
Successful adoption starts with clean, governed data, a well-designed semantic model, user training, and clearly defined business objectives. Organizations should also establish data security and governance policies to ensure AI-generated insights remain accurate and compliant.

A passionate Technical writer and an SEO freak working as a Content Development Manager at iFour Technolab, USA. With extensive experience in IT, Services, and Product sectors, I relish writing about Azure Cloud, Data Analytics, AI, & Workflow Automation and love sharing exceptional insights on various platforms. I believe in constant learning and am passionate about being better every day.


Access the Full EBook here!
Want Faster Power BI Reports?
This eBook shows you how.
Build Your Agile Team
Recent Posts
Top AI Frameworks Recommended on Reddit For Enterprise Use
October 19, 2026

AI in Legal Practice: Powerful Use Cases Every Lawyer Should Know
September 10, 2026
How to Use Power BI for Sales Forecasting (Guide for CTOs)
August 06, 2026
AI in Power BI - Top Use cases and Best Practices
August 03, 2026
Categories
The most successful companies don't just study the past. They prepare for the future. But how do they do that? Well, for many of them, the answer starts with Microsoft Power...
Remember our last guide - Power BI forecasting? It revealed things that truly blocks accuracy, both structural and situational. Now it's time to take the next step. Knowing Power...
Did you know that 70% of CTOs (Chief Technology Officers) hesitate to adopt Microsoft Power BI because of its myths and misconceptions that float around. What they fail to see is...

Get this Demo!
Get this Demo!
Get this Demo!
Get this Demo!
Get this Demo!
Get this Demo!