Our Insights
Innovative Ways - Satisfied Clientele

We use cookies to improve your experience on our site. Please accept cookies for optimal performance.

601 & 612, The Times square Arcade, Near Baghban party plot, Thaltej - Shilaj Road, Thaltej, Ahmedabad, Gujarat - 380059
Request For a Free Consultation
Innovative Ways - Satisfied Clientele
Kapil Panchal - July 13, 2021
Table of Content 1.Introduction 2.What is rendering? 3. Example of rendering 4. What is Mounting? 5. The life cycle of mounting 5.1. Mounting 5.2 Updating 5.3 Unmounting 6. Conclusion Introduction Render is a class-based component that gets called and returns the set of instructions for creating DOM. Mounting is when the component renders first time and indeed builds the initial DOM from that instruction. What is rendering? Render()...
Kapil Panchal - July 08, 2021
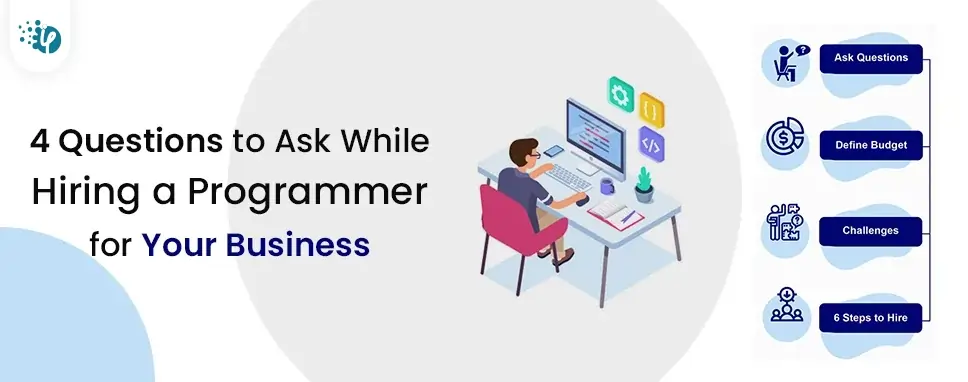
In this article, we will be going over some of the questions you can ask when hiring a programmer for your business. The job of a programmer, particularly for startups, is critical. At times programmers are the only people that understand the application and the business behind it. So, if your business is centered around a product you need to get right, make sure the programmer understands exactly what you want. Table of Content 1. What are the skills of the programmer? 2. What...
Kapil Panchal - July 07, 2021
Table of Content 1. What is Auth0? 2. What is NgRx in Angular? 3. Implement Auth0 in Angular application with NgRx: 3.1 Create an Angular app and Install the Dependencies 3.2 Add the Auth service abstraction 4. Include AuthModule 4.1 Add NgRx 4.2 Add the Actions 4.3 Add the reducer and the state 4.4 Add the effects 4.5 Add the selectors 4.6 Build component 5 Conclusion What is Auth0? Auth0 is a versatile, drop-in...

Kapil Panchal - July 07, 2021
Table of Content 1. Introduction 2. What are props? 3. How to declare props? 4. How to pass the value? 5. What is State? 6. How To Update a Component’s State? 7. What happens when the state changes? 8. Can we use state in every component? 9. What are the differences between props and state? 10. Full development example of props and state 11. Conclusion Introduction When we talk about State and Props, both are considered as variables, but they...

Kapil Panchal - July 06, 2021
Table of Content 1. What is a Thumbnail? 2. Why We Use Thumbnails? 3. When Thumbnails Are Useful? 4. Some Examples for Thumbnails 5. Generate Thumbnails Image 6. Conclusion What is a Thumbnail? Thumbnail is an image with a reduced file size of the actual image that is used as at a time of uploading image. Why We Use Thumbnails? The main advantage of thumbnail image is to reduce the file size using thumbnail image to load websites...
Recent Posts

4 Types of Healthcare Analytics with Examples & Success Stories
February 12, 2026

Ethical Issues in Healthcare: Key Considerations For AI
February 03, 2026

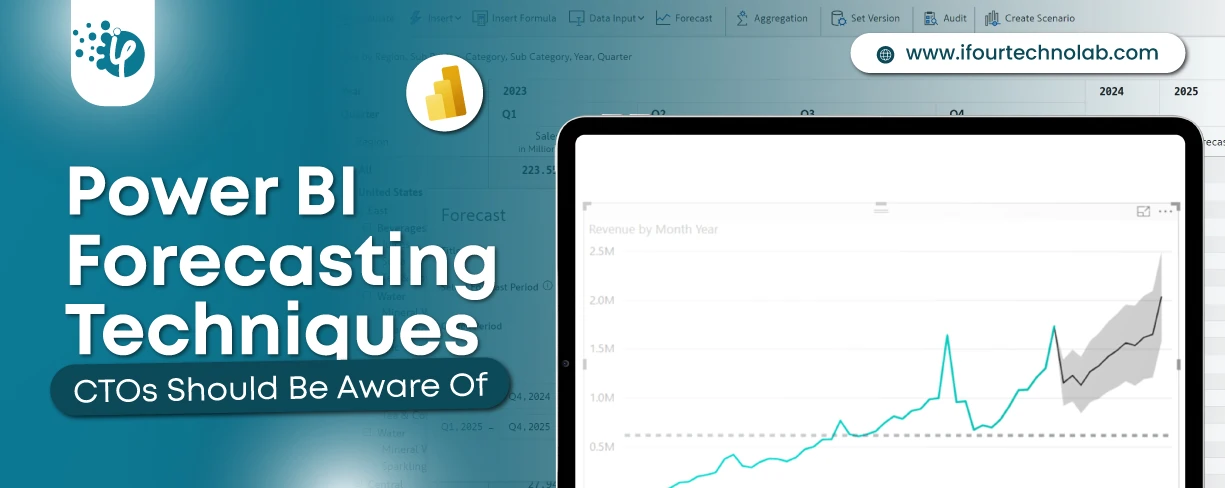
How to Do Forecasting in Power BI (Steps & Accuracy Metrics)
December 02, 2025
ETL vs ELT: Key Differences, Benefits & Use Cases Explained
November 26, 2025
Categories

