×

iFour Logo

Power BI Forecasting Challenges and Solutions

Kapil Panchal - July 19, 2024

Listening is fun too.

Straighten your back and cherish with coffee - PLAY !

  • play
  • pause
  • pause
Power BI Forecasting Challenges and Solutions

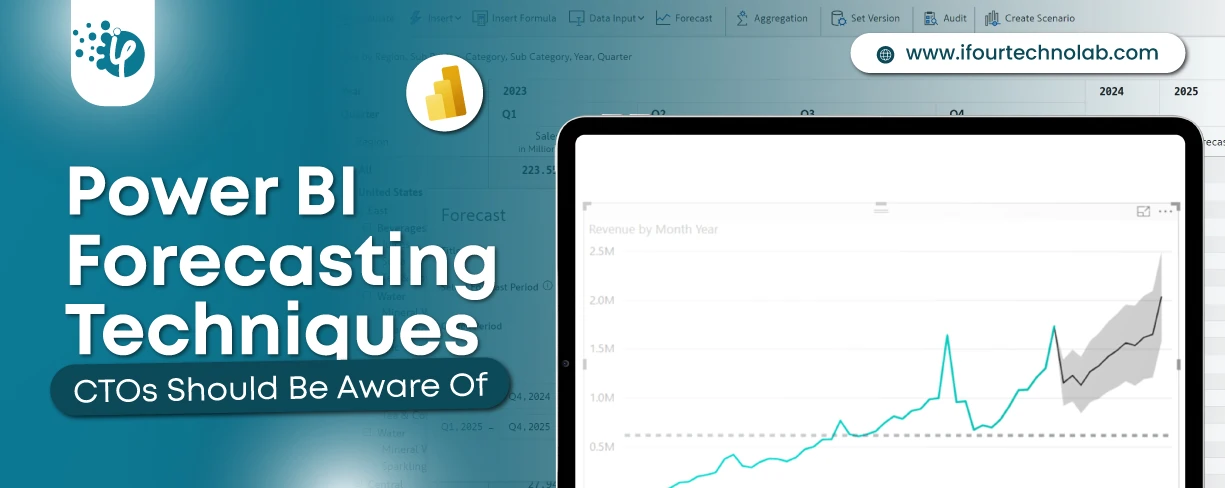
Microsoft Power BI stands out for detailed data forecasting. By inspecting data patterns and using statistical models, Power BI provides a visual forecast of things to anticipate in the future. And this remains essential for businesses to make plans and strategies.

But, Power BI like any other tool, also has certain challenges in data forecasting which includes - data gaps, changing patterns, etc. And how to overcome these challenges is a big question for several CTOs and C-level executives.

We have prepared a list of Power BI forecasting challenges along with their prominent solutions to help you make the most out of Power BI’s forecasting capabilities.

Before we explore the forecasting challenges, let's first understand how to perform business forecasting with Power BI.

How to use Power BI for forecasting?

Power BI solutions aid businesses in data-driven decision-making and forecasting future trends. Follow the steps below to use Power BI to forecast data effectively.

1. Prepare Your Data

Collect and organize historical data relevant to your forecast in Power BI, ensuring it is clean and structured with consistent time intervals for accuracy.

2. Import Data into Power BI

Use the "Get Data" feature in Power BI to import your dataset. This lets you connect to various sources such as Excel, SQL Server, or cloud-based databases.

3. Create a Time-Series Model

In the report view, choose your dataset and generate a "Line Chart" visualization. You can set the time dimension on the x-axis and the metric you want to predict (e.g., sales, website traffic) for the y-axis.

Get custom apps developed faster with our Power Apps consulting services

4. Apply Forecasting

Open the “analytics” pan with the line chart selected. Next, click on "Forecast" and configure the forecasting parameters such as forecast length, periodic patterns in your data, and confidence intervals.

5. Customize and Analyze Data Forecasting with Power BI

Power BI data forecasting will be generated automatically by analyzing your historical data, and this forecast will be presented in the line chart.

You can customize the forecast by just modifying the variables and analyzing different scenarios to ensure accuracy and reliability.

6. Publish and Share

Now we are at the last step to publish and share, once the forecast is ready, you can publish the report to the Power BI service.

You can share reports with stakeholders using interactive dashboards to facilitate collaborative decision-making. This way, everyone can access forecasted insights, that promote transparency and alignment within the team.

This is how we can use effective data forecasting using Power BI to predict future trends, plan better strategies for decision-making, and handle tasks easily.

15 Power BI Data Forecasting Challenges and Solutions

Power BI remains an excellent tool for secure and scalable data analysis and forecasting. Let’s look into the Power BI forecasting challenges and their relevant solutions.

1. Limited Historical Data

Problem: A limited number of historical data can result in inaccurate forecasts.

Solution: It needs to get more historical data, use external datasets to supplement the internal data, or consider using short-term forecasts until more data is available.

2. Seasonal Variations

Problem: It needs to get more historical data, use external datasets to supplement the internal data, or consider using short-term forecasts until more data is available.

Solution: We can use Power BI's seasonality detection tool to account for recurring patterns in the data. Ensure the seasonality parameter is correctly set when configuring the forecast.

3. Outliers and Irregularities

Problem: Power BI data forecasting results may be affected by outliers.

Solution: Clean the data to remove or adjust for outliers. Use Power BI’s data transformation tools to identify and handle irregularity before running the forecast.

4. Data Gaps

Problem: Gaps in the data can disrupt the forecasting model and reduce its reliability. These missing points can cause inaccuracies in predictions.

Solution: Add missing data using Power BI’s data transformation functions or you can adjust the forecast settings to account for gaps.

5. Inaccurate Data Granularity

Problem: Using data at the incorrect level of detail can impact the accuracy of the forecast.

Solution: Adjust the data by either combining or breaking it down to a suitable level of detail that aligns with the forecasting requirements.

6. Complex Data Relationships

Problem: Multiple variables and complex relationships can complicate forecasting.

Solution: By using advanced modeling techniques such as multiple regression analysis within Power BI or try integrating with Azure Machine Learning to obtain more results in the models.

Automate your complex workflows with Power Automate consulting services

7. Real-Time Data Integration

Problem: Using real-time data can be challenging.

Solution: Use Power BI’s real-time data streaming capabilities to include the latest data in the forecasts. Ensure that the data pipeline supports real-time data flow.

8. Inefficient Data Model

Problem: Forecasting can be negatively impacted by a data model that is not optimized properly.

Solution: Optimize your data model by removing unnecessary columns, improving data relationships, and using efficient DAX formulas to speed up processing.

9. Changing Data Patterns

Problem: The sudden changes in data patterns like due to market shifts or new regulations can disrupt forecasts.

Solution: Regularly update the models to reflect the most recent data and trends. Use Power BI’s analytics features to detect and respond to these changes quickly.

10. Lack of User Understanding

Problem: Users may not fully understand the forecasting model and its limitations, leading to misuse.

Solution: Provide training and documentation to users on how to interpret forecasts. Include explanations of confidence intervals and potential forecast limitations in your reports.

11. Performance Issues with Large Datasets

Problem: Handling large datasets can slow down Power BI data analysis performance, impacting forecasting efficiency.

Solution: Optimize the data by using aggregations, indexing, and partitioning. Consider using DirectQuery or dataflow features to manage large datasets more effectively.

12. Data Integration Issues

Problem: Difficulty in integrating data from multiple sources can lead to incomplete forecasts.

Solution: Power BI forecasting has a wide range of connectors that one can use to integrate data from various sources. Ensure data is transformed and consolidated correctly before applying the forecast.

13. Inefficient Data Model

Problem: A poorly optimized data model can slow down forecasts in Power BI.

Solution: Optimize the data model by removing unnecessary columns, improving data relationships, and using efficient DAX formulas to speed up processing.

14. Managing Non-Stationary Data

Problem: Forecasting has now become tricky with non-stationary data because its statistical properties change as time progresses.

Solution: Make the data more stable by applying techniques like differencing or detrending before using forecasting models.

Manage your business data effortlessly with Azure SQL database services.

15. User Bias in Model Interpretation

Problem: When people view forecast results with bias, it can lead them to make decisions that might not be the best choice. So, it's important to look at forecasts without letting personal opinions influence decisions too much.

Solution: Implement automated, unbiased forecast generation and provide clear objective explanations of the forecast results to minimize personal biases.

By addressing forecasting issues in Power BI, it can further enhance the effectiveness and accuracy of advanced forecasts in Power BI and ensure robust and reliable insights for an organization.

Solve Data Challenges with Power BI Forecasting

Power BI forecasting helps organizations anticipate future trends and make smart choices. However, challenges such as data quality, seasonality, and integration issues can impact accuracy. Finding solutions to these challenges is a big issue for many CTOs and executives.

In this blog, we discussed some common forecasting issues in Power BI and how to solve them. With proper solutions, businesses can optimize their forecasting models with full potential for strategic planning and competitive advantage.

Approach iFour to get Power BI consulting services. Our Power BI experts will provide you with the relevant guidance to understand your business and help you enable strategic growth. Partner with us to build the best Power BI solutions.

FAQs for Microsoft Power BI Forecasting

1. What algorithms does Power BI Forecast use?

Power BI forecast component utilizes an exponential smoothing algorithm and ARIMA (AutoRegressive Integrated Moving Average) model for data forecasting.

2. Why can't I forecast in Power BI?

The line chart in Power BI is mainly used for making predictions. It allows you to see trends over time and you can apply forecasting algorithms to anticipate future values.

3. Which chart is used for forecasting in Power BI?

The line chart in Power BI is mainly used for making predictions. It allows you to see trends over time and you can apply forecasting algorithms to anticipate future values.

4. How to do predictive analytics in Power BI?

To do predictive analytics in Power BI, one can utilize the forecasting options available online like charts, or connect with Azure Machine Learning. Simply get data ready, apply the forecasting tools, and visualize the outcomes to uncover valuable insights about upcoming trends.

5. Can I customize the forecasting parameters in Power BI?

Yes, you can customize forecasting parameters in Power BI. Adjust settings like the confidence interval, seasonality, and the number of points to forecast directly within the analytics pane of a line chart.

6. Can Power BI forecast handle irregular data patterns?

Yes, Power BI forecast can handle irregular data patterns by using advanced algorithms that adapt to various trends and seasonality. It dynamically adjusts to the data patterns, making it suitable for forecasting even with irregular data.

7. Briefly describe Power BI forecasting best practices

The best practices for Power BI forecasting include composing clean and structured data, selecting relevant visualization tools like line charts, and adjusting forecasting specifications to achieve accuracy.

8. What is the best way to improve forecasting accuracy?

There are several methods to enhance forecasting accuracy such as refining data quality, incorporating relevant variables, and regularly assessing and updating forecasting models to adapt to changing patterns and trends.

9. What is the best chart to show forecast accuracy?

A line graph showing real values next to projected values is the ideal chart for visualizing forecast accuracy. When you compare the actual and predicted data points, you can easily estimate how the forecasting is performing over time, locating any disparities or errors.

10. What are the three popular measures of forecast accuracy?

There are various measures available but forecast bias, mean average deviation (MAD), and mean average percentage error (MAPE) are the three popular measures of forecast accuracy.

11. What technique is used to determine forecasting accuracy?

The Mean Absolute Percent Error (MAPE) technique is utilized to determine forecasting accuracy by calculating the mean deviation of the forecasted value to the true value in percentage.

Power BI Forecasting Challenges and Solutions Microsoft Power BI stands out for detailed data forecasting. By inspecting data patterns and using statistical models, Power BI provides a visual forecast of things to anticipate in the future. And this remains essential for businesses to make plans and strategies. But, Power BI like any other tool, also has certain challenges in data forecasting which includes - data gaps, changing patterns, etc. And how to overcome these challenges is a big question for several CTOs and C-level executives. We have prepared a list of Power BI forecasting challenges along with their prominent solutions to help you make the most out of Power BI’s forecasting capabilities. Before we explore the forecasting challenges, let's first understand how to perform business forecasting with Power BI. How to use Power BI for forecasting? Power BI solutions aid businesses in data-driven decision-making and forecasting future trends. Follow the steps below to use Power BI to forecast data effectively. 1. Prepare Your Data Collect and organize historical data relevant to your forecast in Power BI, ensuring it is clean and structured with consistent time intervals for accuracy. 2. Import Data into Power BI Use the "Get Data" feature in Power BI to import your dataset. This lets you connect to various sources such as Excel, SQL Server, or cloud-based databases. 3. Create a Time-Series Model In the report view, choose your dataset and generate a "Line Chart" visualization. You can set the time dimension on the x-axis and the metric you want to predict (e.g., sales, website traffic) for the y-axis. Get custom apps developed faster with our Power Apps consulting services Let’s connect 4. Apply Forecasting Open the “analytics” pan with the line chart selected. Next, click on "Forecast" and configure the forecasting parameters such as forecast length, periodic patterns in your data, and confidence intervals. 5. Customize and Analyze Data Forecasting with Power BI Power BI data forecasting will be generated automatically by analyzing your historical data, and this forecast will be presented in the line chart. You can customize the forecast by just modifying the variables and analyzing different scenarios to ensure accuracy and reliability. 6. Publish and Share Now we are at the last step to publish and share, once the forecast is ready, you can publish the report to the Power BI service. You can share reports with stakeholders using interactive dashboards to facilitate collaborative decision-making. This way, everyone can access forecasted insights, that promote transparency and alignment within the team. This is how we can use effective data forecasting using Power BI to predict future trends, plan better strategies for decision-making, and handle tasks easily. Read More: Microsoft Power BI And PowerApps Development: Transforming The Healthcare Sector 15 Power BI Data Forecasting Challenges and Solutions Power BI remains an excellent tool for secure and scalable data analysis and forecasting. Let’s look into the Power BI forecasting challenges and their relevant solutions. 1. Limited Historical Data Problem: A limited number of historical data can result in inaccurate forecasts. Solution: It needs to get more historical data, use external datasets to supplement the internal data, or consider using short-term forecasts until more data is available. 2. Seasonal Variations Problem: It needs to get more historical data, use external datasets to supplement the internal data, or consider using short-term forecasts until more data is available. Solution: We can use Power BI's seasonality detection tool to account for recurring patterns in the data. Ensure the seasonality parameter is correctly set when configuring the forecast. 3. Outliers and Irregularities Problem: Power BI data forecasting results may be affected by outliers. Solution: Clean the data to remove or adjust for outliers. Use Power BI’s data transformation tools to identify and handle irregularity before running the forecast. 4. Data Gaps Problem: Gaps in the data can disrupt the forecasting model and reduce its reliability. These missing points can cause inaccuracies in predictions. Solution: Add missing data using Power BI’s data transformation functions or you can adjust the forecast settings to account for gaps. 5. Inaccurate Data Granularity Problem: Using data at the incorrect level of detail can impact the accuracy of the forecast. Solution: Adjust the data by either combining or breaking it down to a suitable level of detail that aligns with the forecasting requirements. 6. Complex Data Relationships Problem: Multiple variables and complex relationships can complicate forecasting. Solution: By using advanced modeling techniques such as multiple regression analysis within Power BI or try integrating with Azure Machine Learning to obtain more results in the models. Automate your complex workflows with Power Automate consulting services Contact us 7. Real-Time Data Integration Problem: Using real-time data can be challenging. Solution: Use Power BI’s real-time data streaming capabilities to include the latest data in the forecasts. Ensure that the data pipeline supports real-time data flow. 8. Inefficient Data Model Problem: Forecasting can be negatively impacted by a data model that is not optimized properly. Solution: Optimize your data model by removing unnecessary columns, improving data relationships, and using efficient DAX formulas to speed up processing. 9. Changing Data Patterns Problem: The sudden changes in data patterns like due to market shifts or new regulations can disrupt forecasts. Solution: Regularly update the models to reflect the most recent data and trends. Use Power BI’s analytics features to detect and respond to these changes quickly. 10. Lack of User Understanding Problem: Users may not fully understand the forecasting model and its limitations, leading to misuse. Solution: Provide training and documentation to users on how to interpret forecasts. Include explanations of confidence intervals and potential forecast limitations in your reports. Read More: PowerApps development vs Power BI development: What's the difference 11. Performance Issues with Large Datasets Problem: Handling large datasets can slow down Power BI data analysis performance, impacting forecasting efficiency. Solution: Optimize the data by using aggregations, indexing, and partitioning. Consider using DirectQuery or dataflow features to manage large datasets more effectively. 12. Data Integration Issues Problem: Difficulty in integrating data from multiple sources can lead to incomplete forecasts. Solution: Power BI forecasting has a wide range of connectors that one can use to integrate data from various sources. Ensure data is transformed and consolidated correctly before applying the forecast. 13. Inefficient Data Model Problem: A poorly optimized data model can slow down forecasts in Power BI. Solution: Optimize the data model by removing unnecessary columns, improving data relationships, and using efficient DAX formulas to speed up processing. 14. Managing Non-Stationary Data Problem: Forecasting has now become tricky with non-stationary data because its statistical properties change as time progresses. Solution: Make the data more stable by applying techniques like differencing or detrending before using forecasting models. Manage your business data effortlessly with Azure SQL database services. Get a Quote 15. User Bias in Model Interpretation Problem: When people view forecast results with bias, it can lead them to make decisions that might not be the best choice. So, it's important to look at forecasts without letting personal opinions influence decisions too much. Solution: Implement automated, unbiased forecast generation and provide clear objective explanations of the forecast results to minimize personal biases. By addressing forecasting issues in Power BI, it can further enhance the effectiveness and accuracy of advanced forecasts in Power BI and ensure robust and reliable insights for an organization. Solve Data Challenges with Power BI Forecasting Power BI forecasting helps organizations anticipate future trends and make smart choices. However, challenges such as data quality, seasonality, and integration issues can impact accuracy. Finding solutions to these challenges is a big issue for many CTOs and executives. In this blog, we discussed some common forecasting issues in Power BI and how to solve them. With proper solutions, businesses can optimize their forecasting models with full potential for strategic planning and competitive advantage. Approach iFour to get Power BI consulting services. Our Power BI experts will provide you with the relevant guidance to understand your business and help you enable strategic growth. Partner with us to build the best Power BI solutions. Read More: 15 Benefits of Power Apps for CTOs FAQs for Microsoft Power BI Forecasting 1. What algorithms does Power BI Forecast use? Power BI forecast component utilizes an exponential smoothing algorithm and ARIMA (AutoRegressive Integrated Moving Average) model for data forecasting. 2. Why can't I forecast in Power BI? The line chart in Power BI is mainly used for making predictions. It allows you to see trends over time and you can apply forecasting algorithms to anticipate future values. 3. Which chart is used for forecasting in Power BI? The line chart in Power BI is mainly used for making predictions. It allows you to see trends over time and you can apply forecasting algorithms to anticipate future values. 4. How to do predictive analytics in Power BI? To do predictive analytics in Power BI, one can utilize the forecasting options available online like charts, or connect with Azure Machine Learning. Simply get data ready, apply the forecasting tools, and visualize the outcomes to uncover valuable insights about upcoming trends. 5. Can I customize the forecasting parameters in Power BI? Yes, you can customize forecasting parameters in Power BI. Adjust settings like the confidence interval, seasonality, and the number of points to forecast directly within the analytics pane of a line chart. 6. Can Power BI forecast handle irregular data patterns? Yes, Power BI forecast can handle irregular data patterns by using advanced algorithms that adapt to various trends and seasonality. It dynamically adjusts to the data patterns, making it suitable for forecasting even with irregular data. 7. Briefly describe Power BI forecasting best practices The best practices for Power BI forecasting include composing clean and structured data, selecting relevant visualization tools like line charts, and adjusting forecasting specifications to achieve accuracy. 8. What is the best way to improve forecasting accuracy? There are several methods to enhance forecasting accuracy such as refining data quality, incorporating relevant variables, and regularly assessing and updating forecasting models to adapt to changing patterns and trends. 9. What is the best chart to show forecast accuracy? A line graph showing real values next to projected values is the ideal chart for visualizing forecast accuracy. When you compare the actual and predicted data points, you can easily estimate how the forecasting is performing over time, locating any disparities or errors. 10. What are the three popular measures of forecast accuracy? There are various measures available but forecast bias, mean average deviation (MAD), and mean average percentage error (MAPE) are the three popular measures of forecast accuracy. 11. What technique is used to determine forecasting accuracy? The Mean Absolute Percent Error (MAPE) technique is utilized to determine forecasting accuracy by calculating the mean deviation of the forecasted value to the true value in percentage.
Kapil Panchal

Kapil Panchal

A passionate Technical writer and an SEO freak working as a Content Development Manager at iFour Technolab, USA. With extensive experience in IT, Services, and Product sectors, I relish writing about technology and love sharing exceptional insights on various platforms. I believe in constant learning and am passionate about being better every day.

Build Your Agile Team

Enter your e-mail address Please enter valid e-mail

Categories

Ensure your sustainable growth with our team

Talk to our experts
Sustainable
Sustainable
 
Blog Our insights
10 Executive Dashboard Examples for Consultants and CEOs

There is a principle behind every business. “If you don’t keep track of essentials, you won’t get clear direction, eventually causing your company to stumble.” To manage this scenario,...

How Spatial Data Analysis Improves Healthcare

Do you know when geospatial analysis took traction in healthcare? It was when John Snow, a London-based physician, used it to analyze the spread of cholera, which ultimately proved...

4 Types of Power BI Dashboards: Analytical, Strategic, Operational, and Tactical

One interesting aspect you truly love about Power BI, as a CTO, is how it lets you step back and see the bigger picture of your business. Isn’t it? Without getting bogged down in minute...