Can you believe that 147 zettabytes of data have already been created in 2024, and guess what? It is anticipated to be 180 zettabytes by 2025 (according to Statista). Now just think - how important it is to use data analytics tools to turn all that raw business data into something organized and easy to understand.
Data analytics works in all sorts of businesses – fintech, retail, legal, or healthcare and it is growing at a breakneck pace. So, making decisions based on data is essential, whether through the use of data analytics platforms like Tableau or Power BI consulting services or through other ways.
In this blog, we will explore the top data analytic trends that are making news in the business sphere.
What are the most important data analytics trends for 2024?
Given below are some of the top data analytics trends that are expected to shape business decision-making. These platforms, when grasped thoroughly, help you respond to market shifts and trends quickly.
1. Natural Language Processing (NLP) Advancements
With better text analysis, NLP can quickly review large amounts of information like emails, social media comments, and customer reviews. This helps companies understand what customers are saying, how they feel, and what trends are happening in the market.
Another big development is the rise of analytics interfaces. These tools allow people to ask questions about their data using everyday language without needing to know complicated technical terms. For example, instead of writing complex queries a user can simply type or speak a question like, "What were the top-selling products last month?" This makes data analysis easier for everyone in the business, even those without a technical background.
Exclusive NLP Features to Boost Your Decision-Making Power
- Conversational Data Queries: Just ask your questions in natural language, and the system will interpret and give you insights or visualizations.
- Sentiment Analysis for Decision-Making: Quickly analyze customer feedback and social media to understand public sentiment, helping you adjust your strategies fast.
- Contextual Insights Extraction: Pull relevant insights from unstructured data sources, turning raw information into actionable knowledge.
Hire Power BI developer to build your industry-specific dashboards
NLP Analytics Case Study:
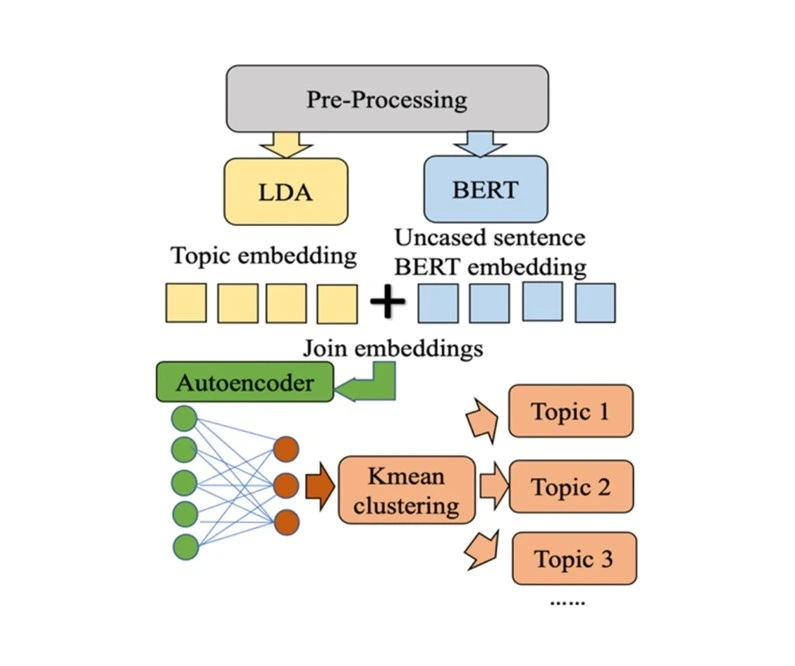
Twitter Analytics using NLP for Public Health Crisis USA.
Key Highlights of the Research:
- NLP Effectiveness Natural language processing can significantly reduce the volume of community feedback.
- Human Interpretation Human interpretation is crucial for maintaining context and depth in gathered information.
- Overall Success The applied approach effectively minimized community feedback
2. DataOps and MLOps
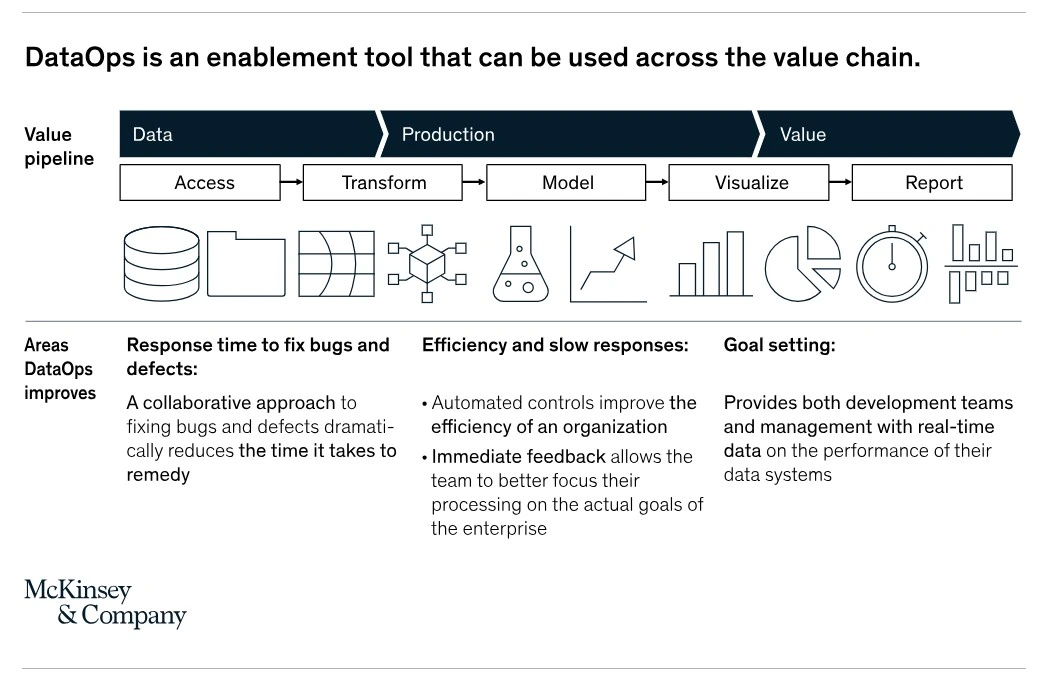
DataOps and MLOps are key practices that help streamline data operations and machine learning processes, making them more efficient and organized. DataOps focuses on improving the way data is managed, processed, and delivered across an organization, while MLOps is centered around the lifecycle of machine learning models, from development to deployment and maintenance.
Both practices aim to create smoother workflows by bringing together data scientists, IT teams, and other stakeholders. This collaboration leads to faster and more reliable results. For example, DataOps ensures that data is always clean, accurate, and available for analysis, while MLOps helps manage machine learning models, ensuring they perform well even as new data comes in.
DataOps and MLOps Features for Decision-making
- Continuous Integration/Continuous Deployment (CI/CD) for Data Quickly integrate and deploy new data pipelines and models, allowing for rapid updates and iterations.
- Collaborative Workflows Work seamlessly with data engineers and scientists on shared platforms, boosting productivity and creativity.
- Automated Testing for Data Quality Keep your data reliable by automatically testing datasets and models before they go live.
Example of DataOps and MLOps Analytics
A team of experts at McKinsey & Company used DataOps and MLOps to perform advanced data analysis, and here is what they secured:
- Automatic Model Documentation that can be easily reused.
- Faster Testing Testing that makes things move quicker.
- Faster and easier data and tools setup.
- Model Monitoring Models are checked and fixed automatically when needed.
- Better Teamwork eliminating time on repetitive fixes.
- Every change in the model is tracked, making it easy to repeat steps if needed.
3. AI-Powered Analytics
AI-powered analytics in businesses approach data analysis. By integrating AI into data analysis tools, companies can automate the process of gathering, processing, and interpreting data. This allows for quicker and more accurate insights that help agencies make decisions faster.
One of the key advantages is automated insight generation, where AI algorithms analyze large datasets and identify trends or patterns without the need for manual intervention. This not only saves time but also helps uncover valuable insights that might be missed through traditional methods. AI enhances predictive analytics by providing more accurate forecasts based on historical data, allowing businesses to plan ahead and respond to market changes.
Build your MVP faster with #1 Power Apps Consulting company
AI-Powered Analytics to foster Quick Decisions
- Automated Insights Generation You can quickly spot trends and anomalies without lifting a finger, letting you focus on strategy instead of sifting through data.
- Self-Learning Algorithms These tools get better over time, learning from your interactions and past data to improve future predictions.
- Smart Data Visualization You’ll receive visual reports tailored to your preferences, making insights easy to understand at a glance.
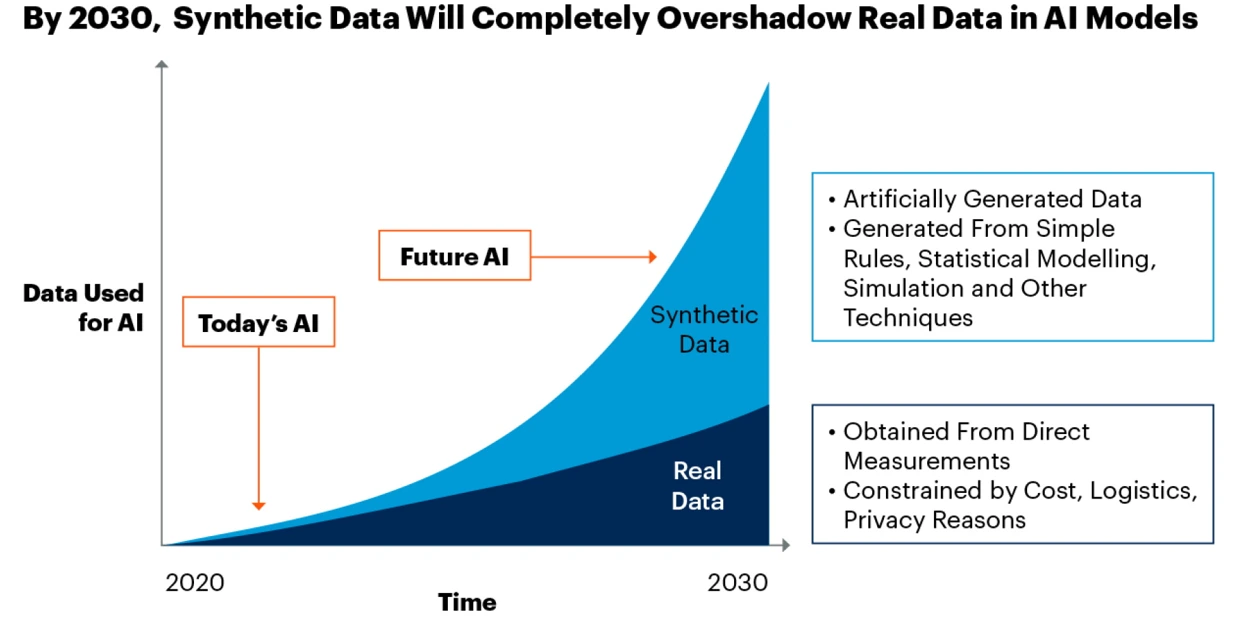
Creating synthetic data is possible using AI-powered analytics. What’s so amazing is - this tool can help in embracing trained datasets to machine-learning models. Here are the highlights
Machine Learning Dataset Generation
- Generating training datasets for machine learning models.
- Tools: ChatGPT, Mostly AI, Gretel AI.
- Enables testing of models with generated data.
- Ideal for obtaining hard-to-reach training datasets like images and videos.
4. Augmented Analytics
Augmented analytics is a powerful combination of AI, machine learning, and analytics that is changing how businesses work with data. By using AI and machine learning, augmented analytics can automate many parts of the data analysis process, making it faster and easier for companies to find valuable insights.
Read More: Microsoft Fabric vs Power BI – Key Insights
One of the main benefits of augmented analytics is enhanced data preparation. Preparing data for analysis can take a lot of time and effort. However, with AI tools, data is cleaned, sorted, and organized automatically, reducing the workload for data teams. This allows businesses to focus more on using the insights instead of spending too much time preparing the data.
Augmented Analytics Features for Smart Decision-making
- Automated Data Preparation Let AI handle data cleaning and transformation, so you can spend more time analyzing and less time getting things ready.
- Guided Analytics Workflows Enjoy step-by-step assistance, making complex analyses easier without needing to be a tech whiz.
- Intelligent Recommendations Get suggestions for the best analytical methods and visualizations based on your data type and goals.
Augmented Analytics Use Case:
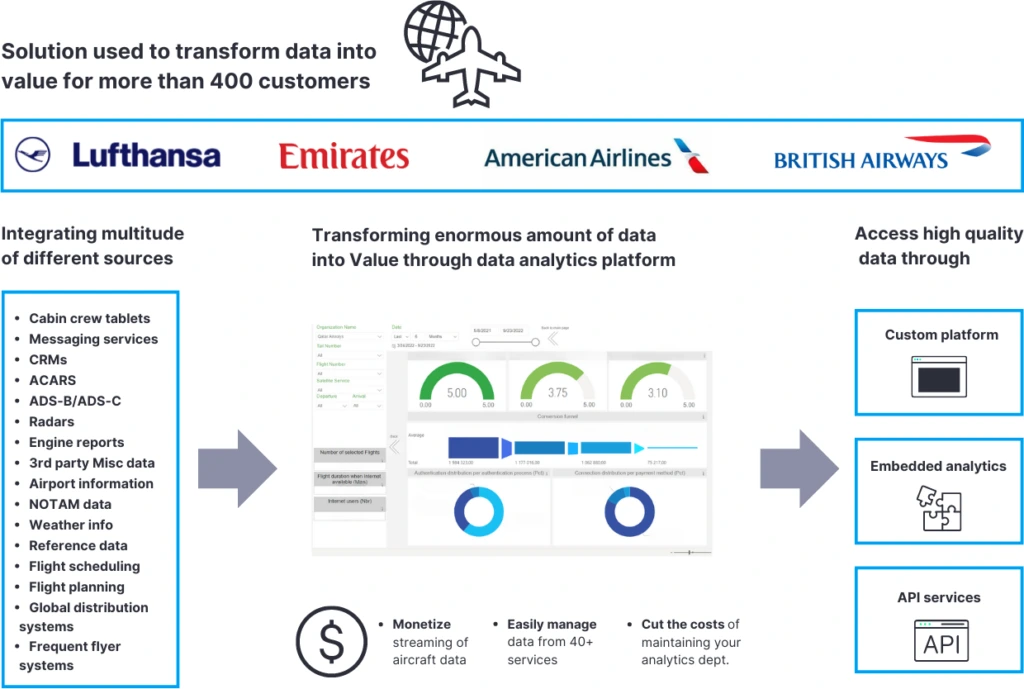
Connected Aircraft using Augmentation
Highlights of this Global Airlines' Data Analytics Solution
- Facilitates better decision-making and data monetization through comprehensive analytics.
- Supports Unified Aircraft Communications, Aircraft Data Management, Digital Day of Operations, and Cabin connectivity services.
- Implements a scalable, comprehensive Data Analytics Platform with AI-augmented capabilities.
- Reduces maintenance team through unified tech-stack, self-service approach, and proper data governance.
- Aims to model and transform data into meaningful KPIs and metrics.Facilitates easy data monetization through services provided to over 400 airlines.
5. Predictive and Prescriptive Analytics
Predictive and prescriptive analytics are two powerful tools that help businesses make informed decisions based on data. Predictive analytics focuses on forecasting future outcomes by analyzing historical data and identifying patterns. With more accurate forecasting models, companies can expect trends and changes in the market, allowing them to plan better and allocate resources efficiently.
For example, retailers can use predictive analytics to forecast sales during peak seasons helping them manage inventory more effectively.
Automate your business workflows effortlessly with Power Automate consulting services
On the other hand, prescriptive analytics goes a step further by providing actionable recommendations based on the data analyzed. This type of analytics suggests specific actions that businesses should take to achieve desired outcomes.
For instance, a company might use prescriptive analytics to determine the best pricing strategy for a new product based on market conditions, competitor pricing, and customer preferences.
Key Features of Predictive and Prescriptive Analytics
- Scenario Simulation: Model different future scenarios to see potential outcomes, helping you plan strategically and assess risks.
- Dynamic KPI Adjustments: Watch as key performance indicators adjust automatically based on predictions, keeping you aligned with changing business goals.
- Actionable Alerts: Receive notifications about potential risks or opportunities based on predictive insights, so you can make proactive decisions.
Read More: Power BI vs Excel - What to Choose When?
Use case of Predictive and Prescriptive Analytics
The Bayes classifier is a machine learning tool that uses math (Bayes' Theorem) to guess how likely something is to happen based on past events. Another tool, ID3, builds a decision tree, like a flowchart, to predict possible outcomes based on data. Both of these tools learn from old data so they can make predictions about new data.
6. Edge Computing in Analytics
It enables decentralized data processing, which means that data is processed closer to where it is generated rather than in centralized data centres.
Let’s see how edge computing impacts data analytics. Edge computing brings data analytics closer to the source, which reduces latency and speeds up processing times. This is especially useful for industries like manufacturing, healthcare, and retail, where real-time analytics are crucial for optimizing operations and improving customer experiences. With decentralized data processing businesses can also handle large volumes of data more efficiently without overloading central servers.
The real-time analytics capabilities provided by edge computing allow organizations to gain immediate insights from data generated by IoT devices, sensors, and other sources. This leads to better decision-making and faster responses to market changes. As edge computing becomes more widespread, its impact on data analytics will continue to grow, offering businesses more flexibility and efficiency in handling and analyzing data.
Edge Analytics – Unique features
- Real-Time Data Processing: Analyze data right where it’s created (like on IoT devices) for faster decision-making in critical situations.
- Local Anomaly Detection Instantly catch outliers or faults on the spot, so you can take immediate action without waiting for cloud processing.
- Resource Optimization: The system smartly allocates resources based on what you need, ensuring you use bandwidth and power efficiently.
Personalize your enterprise software with .NET development company
Edge Analytics Use Case in Healthcare
In healthcare, edge analytics helps doctors monitor patients in real-time. Devices like wearables and sensors collect health data instantly, giving doctors useful info right away. By processing data on-site, doctors get quick alerts, helping them take action before any serious issues happen
7. Cloud-Native Analytics Platforms
Cloud native analytics platforms are changing how businesses analyze data by providing scalable and flexible solutions. These platforms are designed to work seamlessly in the cloud allowing companies to easily adjust their resources based on their cloud analytics needs. This means that whether a business has a small or large amount of data to analyze it can scale up or down without any hassle. This flexibility helps organizations respond quickly to changing demands and ensures they only pay for what they use.
Another advantage of cloud native analytics platforms is their integration with various cloud services. This allows businesses to connect their analytics tools with other cloud applications easily such as data storage and processing services. With this integration, companies can access and analyze their data in real-time leading to faster insights and better decision-making.
Features of Cloud-Native Analytics Platforms
- Seamless Scalability: Watch your resources scale automatically based on demand, ensuring everything runs smoothly during peak times without extra effort
- Cross-Platform Integration Easily connect various data sources and tools, giving you a comprehensive view of your analytics.
- Collaborative Data Workspaces Cloud-based data analytics platforms help you share environments with your team to analyze and visualize data together, enhancing collaborative decision-making.
8. Data Privacy and Ethics
Data privacy and ethics are very important as businesses collect more information from people. Enhanced data protection measures help keep this sensitive information safe. Companies are now using better security methods to prevent data breaches and keep unauthorized users away from personal data. This includes encrypting data, doing regular checks, and following rules like GDPR and CCPA. By focusing on data protection, businesses can gain their customers’ trust and ensure their information is secure.
Along with protection, it is also important to think about how data is used. Companies should be clear about what data they collect and how they plan to use it. They need to make sure that they are using data fairly and responsibly without any bias.
By prioritizing data privacy and ethics, companies can create a culture that values responsibility. This not only helps protect customers but also improves the company's reputation.
Data Privacy and Ethics to Guide Informed Decision-making
- Automated Compliance Reporting: Generate compliance reports effortlessly, making it easier to meet data protection regulations.
- Ethical Decision Frameworks: Ensure that your analytical processes consider ethical implications, respecting privacy and fairness in your decisions.
- Privacy-First Analytics Models Use models that prioritize user anonymity, allowing you to gain insights without compromising privacy.
9. Increasing Reliance on Data-as-a-Service
Data-as-a-Service (DaaS) is becoming increasingly popular as businesses recognize the benefits of accessing data and analytics via cloud computing. Unlike traditional methods where data is analyzed or stored locally on company servers, DaaS delivers data services over the internet, making it more convenient and efficient for users.
With DaaS, businesses can access vast amounts of data stored in the cloud without needing to maintain their own data infrastructure. This means that companies do not have to invest in expensive hardware or software to analyze and store data locally. Instead, they can subscribe to DaaS providers who handle the storage, processing, and analysis of data on their behalf.
The cloud-based model allows users to access real-time data and analytics from anywhere with an internet connection. This flexibility is particularly beneficial for organizations that require quick insights to make informed decisions. Additionally, DaaS providers often offer advanced tools and technologies that enable businesses to leverage powerful analytics without needing specialized skills.
Take your business to new heights with Azure SQL Database services
Key features of Data-as-a-Service for Decision-making
- Subscription-Based Data Access: Choose flexible subscription models to access datasets and analytical tools, so you only pay for what you really need.
- Rapid Data Integration: Quickly integrate external datasets into your systems, enriching your analytics without a heavy workload.
- Tailored Analytics Solutions: Get customized analytics packages based on your specific industry needs, ensuring they’re relevant to your business context.
That's it for this blog! By learning about these top data analytics trends, you'll find out just how much accurate visuals can affect your business decisions.
Top Data Analytics Trends – Key Takeaways
In this blog, we discussed what are the most important data analytics trends for 2024. We explored how some of the main trends in data analytics for 2024 - AI-powered analytics, edge computing, augmented analytics and Data as a Service are changing business operations with data.
Companies need to stay updated on these trends to remain competitive and make the most of their data.
Want to visualize your big data effortlessly with custom dashboards? Connect with us and access our Power BI consulting services right away. At iFour, we have expert data analytics experts with extensive experience and can help you make the most out of the top data analytics trends.
FAQs on Data analytics trends
1. How is artificial intelligence changing the field of data analytics?
AI is revolutionizing the technology field, and AI analytics is fueling its power by automating tasks that used to take a lot of time like data cleaning and pattern recognition. This lets analysts focus on interpreting the data and making strategic decisions. Connect iFour to get assistance for AI in analytics.
2. What skills do I need to pursue a career in data analytics?
To get into data analytics, you will want to know your way around statistics and know programming languages like Python or R. Familiarity with data visualization tools (like Tableau or Power BI) and databases (like SQL) is also needed. plus having good problem-solving skills will really help you in this field.
3. How can small businesses benefit from data analytics?
Small businesses can use data analytics to understand their customers better, streamline their operations, and improve their marketing efforts. This helps them make smarter, data-driven decisions that can lead to increased sales and competitiveness in the market. Power BI, and Tableau, are some of the top tools for data visualization businesses may adopt.
4. What are the challenges in implementing data analytics in an organization?
Some common challenges include dealing with poor quality data, integrating various data sources and finding people with the right skills. There can also be resistance from employees who are used to doing things a certain way and organizations need to ensure they comply with data privacy regulations.
5. What role does data privacy play in modern analytics?
Data privacy is a big deal today, especially with laws like GDPR and CCPA. Companies need to protect customer information to build trust and avoid legal trouble. Being transparent about how data is used also helps maintain that trust.
6. How can data analytics improve customer experience?
Data analytics helps businesses understand what their customers want and need allowing for more personalized marketing and better product offerings. By analyzing customer feedback and behavior, companies can improve their services and create a better overall experience for their customers. So adopting Data Science related tools is essential for data-driven decision making.
7. What are the differences between descriptive, predictive, and prescriptive analytics?
- Descriptive analytics looks at past data to explain what happened.
- Predictive analytics uses that data to forecast what might happen in the future
- Prescriptive analytics goes a step further by recommending actions based on both past and predicted data.
Each Business intelligence type serves a different purpose in helping organizations with data-driven decision-making.
8. How is the cloud transforming data analytics practices?
Being one of the emerging trends in data analytics 2024, the cloud is changing the game by making it easier and cheaper for organizations to store and analyze large amounts of data. It allows teams to collaborate more effectively and access real-time data, making it easier to make quick decisions based on current insights.
Top Data Analytics Trends You Can't Ignore Can you believe that 147 zettabytes of data have already been created in 2024, and guess what? It is anticipated to be 180 zettabytes by 2025 (according to Statista). Now just think - how important it is to use data analytics tools to turn all that raw business data into something organized and easy to understand. Data analytics works in all sorts of businesses – fintech, retail, legal, or healthcare and it is growing at a breakneck pace. So, making decisions based on data is essential, whether through the use of data analytics platforms like Tableau or Power BI consulting services or through other ways. Image source In this blog, we will explore the top data analytic trends that are making news in the business sphere. What are the most important data analytics trends for 2024? Given below are some of the top data analytics trends that are expected to shape business decision-making. These platforms, when grasped thoroughly, help you respond to market shifts and trends quickly. 1. Natural Language Processing (NLP) Advancements With better text analysis, NLP can quickly review large amounts of information like emails, social media comments, and customer reviews. This helps companies understand what customers are saying, how they feel, and what trends are happening in the market. Another big development is the rise of analytics interfaces. These tools allow people to ask questions about their data using everyday language without needing to know complicated technical terms. For example, instead of writing complex queries a user can simply type or speak a question like, "What were the top-selling products last month?" This makes data analysis easier for everyone in the business, even those without a technical background. Exclusive NLP Features to Boost Your Decision-Making Power Conversational Data Queries: Just ask your questions in natural language, and the system will interpret and give you insights or visualizations. Sentiment Analysis for Decision-Making: Quickly analyze customer feedback and social media to understand public sentiment, helping you adjust your strategies fast. Contextual Insights Extraction: Pull relevant insights from unstructured data sources, turning raw information into actionable knowledge. Hire Power BI developer to build your industry-specific dashboards Let’s Connect NLP Analytics Case Study: Twitter Analytics using NLP for Public Health Crisis USA. Key Highlights of the Research: NLP Effectiveness Natural language processing can significantly reduce the volume of community feedback. Human Interpretation Human interpretation is crucial for maintaining context and depth in gathered information. Overall Success The applied approach effectively minimized community feedback Image source 2. DataOps and MLOps DataOps and MLOps are key practices that help streamline data operations and machine learning processes, making them more efficient and organized. DataOps focuses on improving the way data is managed, processed, and delivered across an organization, while MLOps is centered around the lifecycle of machine learning models, from development to deployment and maintenance. Both practices aim to create smoother workflows by bringing together data scientists, IT teams, and other stakeholders. This collaboration leads to faster and more reliable results. For example, DataOps ensures that data is always clean, accurate, and available for analysis, while MLOps helps manage machine learning models, ensuring they perform well even as new data comes in. Read More: Power BI vs Tableau - Which Is Best for Data Visualization DataOps and MLOps Features for Decision-making Continuous Integration/Continuous Deployment (CI/CD) for Data Quickly integrate and deploy new data pipelines and models, allowing for rapid updates and iterations. Collaborative Workflows Work seamlessly with data engineers and scientists on shared platforms, boosting productivity and creativity. Automated Testing for Data Quality Keep your data reliable by automatically testing datasets and models before they go live. Example of DataOps and MLOps Analytics A team of experts at McKinsey & Company used DataOps and MLOps to perform advanced data analysis, and here is what they secured: Automatic Model Documentation that can be easily reused. Faster Testing Testing that makes things move quicker. Faster and easier data and tools setup. Model Monitoring Models are checked and fixed automatically when needed. Better Teamwork eliminating time on repetitive fixes. Every change in the model is tracked, making it easy to repeat steps if needed. Image source 3. AI-Powered Analytics AI-powered analytics in businesses approach data analysis. By integrating AI into data analysis tools, companies can automate the process of gathering, processing, and interpreting data. This allows for quicker and more accurate insights that help agencies make decisions faster. One of the key advantages is automated insight generation, where AI algorithms analyze large datasets and identify trends or patterns without the need for manual intervention. This not only saves time but also helps uncover valuable insights that might be missed through traditional methods. AI enhances predictive analytics by providing more accurate forecasts based on historical data, allowing businesses to plan ahead and respond to market changes. Build your MVP faster with #1 Power Apps Consulting company Hire us now AI-Powered Analytics to foster Quick Decisions Automated Insights Generation You can quickly spot trends and anomalies without lifting a finger, letting you focus on strategy instead of sifting through data. Self-Learning Algorithms These tools get better over time, learning from your interactions and past data to improve future predictions. Smart Data Visualization You’ll receive visual reports tailored to your preferences, making insights easy to understand at a glance. AI Analytics example Creating synthetic data is possible using AI-powered analytics. What’s so amazing is - this tool can help in embracing trained datasets to machine-learning models. Here are the highlights Machine Learning Dataset Generation Generating training datasets for machine learning models. Tools: ChatGPT, Mostly AI, Gretel AI. Enables testing of models with generated data. Ideal for obtaining hard-to-reach training datasets like images and videos. Image source 4. Augmented Analytics Augmented analytics is a powerful combination of AI, machine learning, and analytics that is changing how businesses work with data. By using AI and machine learning, augmented analytics can automate many parts of the data analysis process, making it faster and easier for companies to find valuable insights. Read More: Microsoft Fabric vs Power BI – Key Insights One of the main benefits of augmented analytics is enhanced data preparation. Preparing data for analysis can take a lot of time and effort. However, with AI tools, data is cleaned, sorted, and organized automatically, reducing the workload for data teams. This allows businesses to focus more on using the insights instead of spending too much time preparing the data. Augmented Analytics Features for Smart Decision-making Automated Data Preparation Let AI handle data cleaning and transformation, so you can spend more time analyzing and less time getting things ready. Guided Analytics Workflows Enjoy step-by-step assistance, making complex analyses easier without needing to be a tech whiz. Intelligent Recommendations Get suggestions for the best analytical methods and visualizations based on your data type and goals. Augmented Analytics Use Case: Connected Aircraft using Augmentation Highlights of this Global Airlines' Data Analytics Solution Facilitates better decision-making and data monetization through comprehensive analytics. Supports Unified Aircraft Communications, Aircraft Data Management, Digital Day of Operations, and Cabin connectivity services. Implements a scalable, comprehensive Data Analytics Platform with AI-augmented capabilities. Reduces maintenance team through unified tech-stack, self-service approach, and proper data governance. Aims to model and transform data into meaningful KPIs and metrics.Facilitates easy data monetization through services provided to over 400 airlines. Image source 5. Predictive and Prescriptive Analytics Predictive and prescriptive analytics are two powerful tools that help businesses make informed decisions based on data. Predictive analytics focuses on forecasting future outcomes by analyzing historical data and identifying patterns. With more accurate forecasting models, companies can expect trends and changes in the market, allowing them to plan better and allocate resources efficiently. For example, retailers can use predictive analytics to forecast sales during peak seasons helping them manage inventory more effectively. Automate your business workflows effortlessly with Power Automate consulting services Contact us On the other hand, prescriptive analytics goes a step further by providing actionable recommendations based on the data analyzed. This type of analytics suggests specific actions that businesses should take to achieve desired outcomes. For instance, a company might use prescriptive analytics to determine the best pricing strategy for a new product based on market conditions, competitor pricing, and customer preferences. Key Features of Predictive and Prescriptive Analytics Scenario Simulation: Model different future scenarios to see potential outcomes, helping you plan strategically and assess risks. Dynamic KPI Adjustments: Watch as key performance indicators adjust automatically based on predictions, keeping you aligned with changing business goals. Actionable Alerts: Receive notifications about potential risks or opportunities based on predictive insights, so you can make proactive decisions. Read More: Power BI vs Excel - What to Choose When? Use case of Predictive and Prescriptive Analytics The Bayes classifier is a machine learning tool that uses math (Bayes' Theorem) to guess how likely something is to happen based on past events. Another tool, ID3, builds a decision tree, like a flowchart, to predict possible outcomes based on data. Both of these tools learn from old data so they can make predictions about new data. 6. Edge Computing in Analytics It enables decentralized data processing, which means that data is processed closer to where it is generated rather than in centralized data centres. Let’s see how edge computing impacts data analytics. Edge computing brings data analytics closer to the source, which reduces latency and speeds up processing times. This is especially useful for industries like manufacturing, healthcare, and retail, where real-time analytics are crucial for optimizing operations and improving customer experiences. With decentralized data processing businesses can also handle large volumes of data more efficiently without overloading central servers. The real-time analytics capabilities provided by edge computing allow organizations to gain immediate insights from data generated by IoT devices, sensors, and other sources. This leads to better decision-making and faster responses to market changes. As edge computing becomes more widespread, its impact on data analytics will continue to grow, offering businesses more flexibility and efficiency in handling and analyzing data. Edge Analytics – Unique features Real-Time Data Processing: Analyze data right where it’s created (like on IoT devices) for faster decision-making in critical situations. Local Anomaly Detection Instantly catch outliers or faults on the spot, so you can take immediate action without waiting for cloud processing. Resource Optimization: The system smartly allocates resources based on what you need, ensuring you use bandwidth and power efficiently. Personalize your enterprise software with .NET development company Contact Us Now Edge Analytics Use Case in Healthcare In healthcare, edge analytics helps doctors monitor patients in real-time. Devices like wearables and sensors collect health data instantly, giving doctors useful info right away. By processing data on-site, doctors get quick alerts, helping them take action before any serious issues happen 7. Cloud-Native Analytics Platforms Cloud native analytics platforms are changing how businesses analyze data by providing scalable and flexible solutions. These platforms are designed to work seamlessly in the cloud allowing companies to easily adjust their resources based on their cloud analytics needs. This means that whether a business has a small or large amount of data to analyze it can scale up or down without any hassle. This flexibility helps organizations respond quickly to changing demands and ensures they only pay for what they use. Another advantage of cloud native analytics platforms is their integration with various cloud services. This allows businesses to connect their analytics tools with other cloud applications easily such as data storage and processing services. With this integration, companies can access and analyze their data in real-time leading to faster insights and better decision-making. Features of Cloud-Native Analytics Platforms Seamless Scalability: Watch your resources scale automatically based on demand, ensuring everything runs smoothly during peak times without extra effort Cross-Platform Integration Easily connect various data sources and tools, giving you a comprehensive view of your analytics. Collaborative Data Workspaces Cloud-based data analytics platforms help you share environments with your team to analyze and visualize data together, enhancing collaborative decision-making. Read More: How to Automate Power BI Reports Using Power Automate 8. Data Privacy and Ethics Data privacy and ethics are very important as businesses collect more information from people. Enhanced data protection measures help keep this sensitive information safe. Companies are now using better security methods to prevent data breaches and keep unauthorized users away from personal data. This includes encrypting data, doing regular checks, and following rules like GDPR and CCPA. By focusing on data protection, businesses can gain their customers’ trust and ensure their information is secure. Along with protection, it is also important to think about how data is used. Companies should be clear about what data they collect and how they plan to use it. They need to make sure that they are using data fairly and responsibly without any bias. By prioritizing data privacy and ethics, companies can create a culture that values responsibility. This not only helps protect customers but also improves the company's reputation. Data Privacy and Ethics to Guide Informed Decision-making Automated Compliance Reporting: Generate compliance reports effortlessly, making it easier to meet data protection regulations. Ethical Decision Frameworks: Ensure that your analytical processes consider ethical implications, respecting privacy and fairness in your decisions. Privacy-First Analytics Models Use models that prioritize user anonymity, allowing you to gain insights without compromising privacy. 9. Increasing Reliance on Data-as-a-Service Data-as-a-Service (DaaS) is becoming increasingly popular as businesses recognize the benefits of accessing data and analytics via cloud computing. Unlike traditional methods where data is analyzed or stored locally on company servers, DaaS delivers data services over the internet, making it more convenient and efficient for users. With DaaS, businesses can access vast amounts of data stored in the cloud without needing to maintain their own data infrastructure. This means that companies do not have to invest in expensive hardware or software to analyze and store data locally. Instead, they can subscribe to DaaS providers who handle the storage, processing, and analysis of data on their behalf. The cloud-based model allows users to access real-time data and analytics from anywhere with an internet connection. This flexibility is particularly beneficial for organizations that require quick insights to make informed decisions. Additionally, DaaS providers often offer advanced tools and technologies that enable businesses to leverage powerful analytics without needing specialized skills. Take your business to new heights with Azure SQL Database services Let’s Connect Key features of Data-as-a-Service for Decision-making Subscription-Based Data Access: Choose flexible subscription models to access datasets and analytical tools, so you only pay for what you really need. Rapid Data Integration: Quickly integrate external datasets into your systems, enriching your analytics without a heavy workload. Tailored Analytics Solutions: Get customized analytics packages based on your specific industry needs, ensuring they’re relevant to your business context. That's it for this blog! By learning about these top data analytics trends, you'll find out just how much accurate visuals can affect your business decisions. Top Data Analytics Trends – Key Takeaways In this blog, we discussed what are the most important data analytics trends for 2024. We explored how some of the main trends in data analytics for 2024 - AI-powered analytics, edge computing, augmented analytics and Data as a Service are changing business operations with data. Companies need to stay updated on these trends to remain competitive and make the most of their data. Want to visualize your big data effortlessly with custom dashboards? Connect with us and access our Power BI consulting services right away. At iFour, we have expert data analytics experts with extensive experience and can help you make the most out of the top data analytics trends. FAQs on Data analytics trends 1. How is artificial intelligence changing the field of data analytics? AI is revolutionizing the technology field, and AI analytics is fueling its power by automating tasks that used to take a lot of time like data cleaning and pattern recognition. This lets analysts focus on interpreting the data and making strategic decisions. Connect iFour to get assistance for AI in analytics. 2. What skills do I need to pursue a career in data analytics? To get into data analytics, you will want to know your way around statistics and know programming languages like Python or R. Familiarity with data visualization tools (like Tableau or Power BI) and databases (like SQL) is also needed. plus having good problem-solving skills will really help you in this field. 3. How can small businesses benefit from data analytics? Small businesses can use data analytics to understand their customers better, streamline their operations, and improve their marketing efforts. This helps them make smarter, data-driven decisions that can lead to increased sales and competitiveness in the market. Power BI, and Tableau, are some of the top tools for data visualization businesses may adopt. 4. What are the challenges in implementing data analytics in an organization? Some common challenges include dealing with poor quality data, integrating various data sources and finding people with the right skills. There can also be resistance from employees who are used to doing things a certain way and organizations need to ensure they comply with data privacy regulations. 5. What role does data privacy play in modern analytics? Data privacy is a big deal today, especially with laws like GDPR and CCPA. Companies need to protect customer information to build trust and avoid legal trouble. Being transparent about how data is used also helps maintain that trust. 6. How can data analytics improve customer experience? Data analytics helps businesses understand what their customers want and need allowing for more personalized marketing and better product offerings. By analyzing customer feedback and behavior, companies can improve their services and create a better overall experience for their customers. So adopting Data Science related tools is essential for data-driven decision making. 7. What are the differences between descriptive, predictive, and prescriptive analytics? Descriptive analytics looks at past data to explain what happened. Predictive analytics uses that data to forecast what might happen in the future Prescriptive analytics goes a step further by recommending actions based on both past and predicted data. Each Business intelligence type serves a different purpose in helping organizations with data-driven decision-making. 8. How is the cloud transforming data analytics practices? Being one of the emerging trends in data analytics 2024, the cloud is changing the game by making it easier and cheaper for organizations to store and analyze large amounts of data. It allows teams to collaborate more effectively and access real-time data, making it easier to make quick decisions based on current insights.
Build Your Agile Team