How to Do Forecasting in Power BI (Steps & Accuracy Metrics)
Remember our last guide - Power BI forecasting? It revealed things that truly blocks accuracy, both structural and situational. Now it's time to take the next step. Knowing Power...
Listening is fun too.
Straighten your back and cherish with coffee - PLAY !

MS Excel Add-in is a kind of program or a utility that lets you perform fundamental processes more quickly. It does this by integrating new features into the excel application that boosts its basic capabilities on various platforms like Windows, Mac & Web.
The Excel Add-in, as part of the Office platform, allows you to modify and speed up your business processes. Office Add-ins are well-known for their centralized deployment, cross-platform compatibility, and AppSource distribution. It enables developers to leverage web technologies including HTML, CSS, and JavaScript.
More importantly, it provides the framework and the JavaScript library Office.js for constructing Excel Add-ins. In this tutorial, we will walk through the basic yet effective process of creating the Excel Addin using ReactJS.
Before you start creating Excel Add-ins, make sure you have these prerequisites installed on your PC.
To begin, configure and install the Yeoman and Yeoman generator for Office 365 Add-in development.
npm install -g yo generator-office
Now run the following yo command to create an Add-in
yo office
After running the above command, select the Project type as a React framework. Take a look at the reference image below.

Figure 1 Choose a Project Type
After selecting the project, choose TypeScript as your script type.

Figure 2 Choose a Script Type
Now, name your Excel Add-in project as shown below. You can give whatever name you like but giving a project-relevant name would be an ideal move.

Figure 3 Give Name to Add-in
Because it is critical to provide support for the office application, choose Excel as the Office client.

Figure 4 Choose an Office Client
Congratulations!! Your first Excel Add-in is created successfully.
Add-ins are not instantly accessible in Excel by default. We must activate them before we may use them. Let's have a look at how to use a command prompt to execute Add-ins in MS Excel.
Use the following command and open the project folder on the command prompt.
cd Excel_Tutorial
Now start the dev-server as shown below.
npm run dev-server
To test Add-in in your Excel, run the following command in the project’s root directory.
npm start
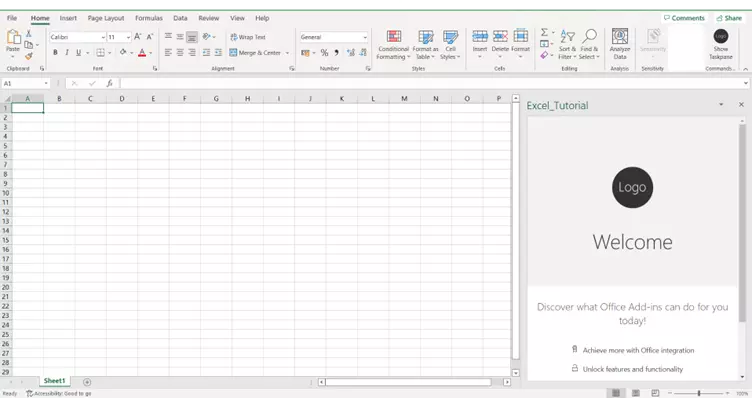
When you complete running this command, you should see a task pane added to Excel that operates like an Excel Add in.

Figure 5 Excel Addin Taskpane
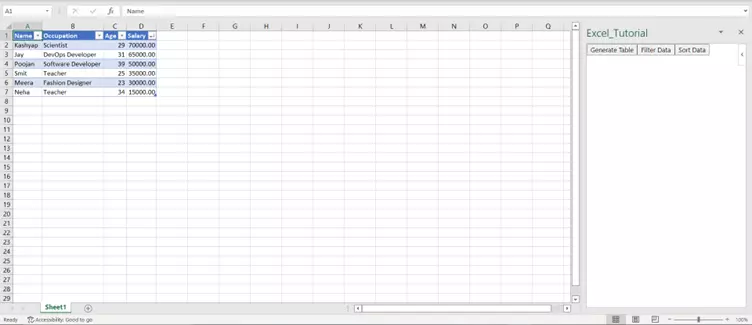
Businesses commonly use tables to present their business data whether it be price, comparison, financial comparison, etc. React.js makes it simple and quick for organizations to manage large amounts of data. Let’s understand the process of creating a table using React.js.
To begin,
import * as React from "react";
import Progress from "./Progress";
export interface AppProps {
title: string;
isOfficeInitialized: boolean;
}
export default class App extends React.Component {
constructor(props, context) {
super(props, context);
this.state = {
listItems: [],
};
}
render() {
const { title, isOfficeInitialized } = this.props;
if (!isOfficeInitialized) {
return (
);
}
return (
);
}
}
This logic will not execute immediately, Instead, it will be added to the queue of pending commands.
The context.sync method sends all pending commands which are in queue to Excel for execution.
The Excel.run method is followed by the catch block.
    handleCreateTable = async () => {
        await Excel.run(async (context) => {

          // logic for create table

          await context.sync();
        }).catch((err) => {
            console.log("Error: " + err);
          });
      }
const currentWorksheet = context.workbook.worksheets.getActiveWorksheet();
Once we get the worksheet, we’ll create a table. Use the following method to create a table.
const salaryTable = currentWorksheet.tables.add("A1:D1", true);
The table is generated by using the add() function on the table collection of the current worksheet. The method accepts the first parameter as a range of the top row of the table.
We can also give a name to our table as shown below.
salaryTable.name = "SalaryTable";
     salaryTable.getHeaderRowRange().values =
    [["Name", "Occupation", "Age","Salary"]];
The table's rows are then inserted using the add() function of the table's row collection. We may add several rows in a single request by sending an array of cell values within the parent array.
     salaryTable.rows.add(null /*add at the end*/, [
      ["Poojan", "Software Developer","39", "50,000"],
            ["Meera", "Fashion Designer","23", "30,000"],
            ["Smit", "Teacher", "25","35,000"],
            ["Kashyap", "Scientist", "29","70,000"],
            ["Neha", "Teacher","34", "15,000"],
            ["Jay", "DevOps Developer","31", "65,000"]
          ]);
salaryTable.columns.getItemAt(3).getRange().numberFormat = [['##0.00']];
    salaryTable.getRange().format.autofitColumns();
    salaryTable.getRange().format.autofitRows();
Let’s take a look at how the entire function appears to be.
    handleCreateTable = async () => {
        await Excel.run(async (context) => {

          const currentWorksheet=context.workbook.worksheets.getActiveWorksheet();
          const salaryTable = currentWorksheet.tables.add("A1:D1", true );
          salaryTable.name = "SalaryTable";

          salaryTable.getHeaderRowRange().values =
            [["Name", "Occupation", "Age", "Salary"]];

          salaryTable.rows.add(null /*add at the end*/, [
            ["Poojan", "Software Developer", "39", "50,000"],
            ["Meera", "Fashion Designer", "23", "30,000"],
            ["Smit", "Teacher", "25", "35,000"],
            ["Kashyap", "Scientist", "29", "70,000"],
            ["Neha", "Teacher", "34", "15,000"],
            ["Jay", "DevOps Developer", "31", "65,000"]
          ]);

          salaryTable.columns.getItemAt(3).getRange().numberFormat = [['##0.00']];
          salaryTable.getRange().format.autofitColumns();
          salaryTable.getRange().format.autofitRows();

          await context.sync();

        }).catch((err) => {
          console.log("Error: " + err);
        });
      }
Filtering data is critical because organizations utilize it to exclude undesired results for analysis. Let's see how data in a table may be filtered for better analysis.
    filterData = async () => {
        await Excel.run(async (context) => {
          await context.sync();
        }).catch((err) => {
          console.log("Error: " + err);
        });
      }
    const currentWorksheet = context.workbook.worksheets.getActiveWorksheet();
    const salaryTable = currentWorksheet.tables.getItem('salaryTable');
const occupationFilter = salaryTable.columns.getItem('Occupation').filter;
Here, Occupation is the column name on which we want to apply the filter.
occupationFilter.applyValuesFilter(['Software Developer', 'Teacher']);
    filterData = async () => {
        await Excel.run(async (context) => {

          const currentWorksheet=context.workbook.worksheets.getActiveWorksheet();
          const salaryTable = currentWorksheet.tables.getItem('salaryTable');
          const occupationFilter=salaryTable.columns.getItem('Occupation').filter;
          occupationFilter.applyValuesFilter(['Software Developer', 'Teacher']);

          await context.sync();
        }).catch((err) => {
          console.log("Error: " + err);
        });
      }
Data sorting is also important since it helps to obtain well-organized data in a sequential manner. Let’s understand in simple ways, how data can be sorted in a table.
To start with,
    sortData=async()=>{
       await Excel.run(async (context) => {
        await context.sync();
        }).catch((err) => {
          console.log("Error: " + err);
        });
      }
    const currentWorksheet = context.workbook.worksheets.getActiveWorksheet();
    const salaryTable = currentWorksheet.tables.getItem('salaryTable');
The key property is the zero-based index of the column, and it is used for sorting. All the rows of data are sorted according to key.
    const sortFields = [
            {
              key: 3,
              ascending: false,
            }
          ];
salaryTable.sort.apply(sortFields);
        sortData = async () => {
            await Excel.run(async (context) => {

              const currentWorksheet=context.workbook.worksheets.getActiveWorksheet();
              const salaryTable = currentWorksheet.tables.getItem('salaryTable');

              const sortFields = [
                {
                  key: 3,
                  ascending: false,
                }
              ];

              salaryTable.sort.apply(sortFields);

              await context.sync();
            }).catch((err) => {
              console.log("Error: " + err);
            });
          }
Finally, run the code with the npm start command. The user will see the following result every time he clicks on the sort data button.
output
Figure 8 Sort Data
Office Add-ins benefit businesses with faster operations and processes. In Office Add-ins, you can use familiar technologies like HTML, CSS & JavaScript to create Outlook, Excel, Word, and PowerPoint Add-ins. In this blog, we learned how to create an Excel Addin with React library from scratch and how to create tables, filter & sort data in Excel using Excel Add-in.

Remember our last guide - Power BI forecasting? It revealed things that truly blocks accuracy, both structural and situational. Now it's time to take the next step. Knowing Power...

It's amazing to see how Data teams today are racing ahead - moving from traditional warehouses to cloud-native platforms, lakehouses, and real-time architectures. But in this rush,...

Think about the last time CTOs spent most of their time fixing old systems. Updates were slow, servers were expensive, and adding new features took time. Now, things have changed....