×

iFour Logo

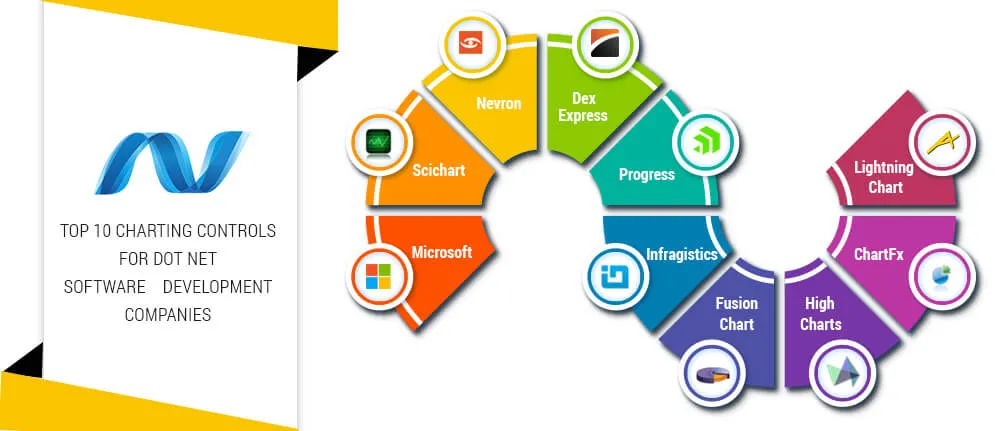
Top 10 charting controls for DOT NET software development companies

iFour Team - October 27, 2016

Listening is fun too.

Straighten your back and cherish with coffee - PLAY !

  • play
  • pause
  • pause
Top 10 charting controls for DOT NET software development companies

In the era of information, data visualization plays an important role in enhancing and making information systems useful to decision makers. This allow important data to be visualized properly so that important concepts, information and analytics are made handy to end users. Charting controls are important for DOT NET software development companies while developing software with data visualization. PIE Chart, LINE Chart, BAR Chart, BUBBLE Chart, PYRAMID chart etc are some of the charts that helps display information meaningfully with analysis. The charting controls allow user with additional features like sorting, filtering, grouping, searching, merging, splitting and exporting data in required format.

In this article, we discuss about Top 10 chart controls that are very popular, feature rich and widely used by custom software companies in USA to build information rich softwares.


1. LightningChart Ultimate


alt text

LightningChart Ultimate is the fastest, popular and widely used 2D and 3D measurement, financing, research and trading data visualization SDK for software development based on WinForms and WPF. LightningChart Ultimate is entirely GPU accelerated (Direct3D) and performance optimized data visualization control for presenting masses of data in 2D XY graph, 3D XYZ, polar, smith and 3D pie / donut views.

Pros Cons
Fastest rendering data visualization toolkit for .net framework Supports only Window and WPF Application
Short loading delays  
Better graphics quality  

2. Telerik RadChart


alt text

RadChart is an unrivalled and performance enhanced charting tool that helps developing next-generation software. It is highly feature rich with great data visualization capability and helps in better analysis of complex data. RadChat allows transformation of business data into animated charts and interactive UI. It is compatible with WPF.

Pros Cons
Supports multiple data sources Does not support scatter line chart
It does not require additional assemblies Server side click events
Better technical support  
Good performance from speed perspective  

3. DevExpress Chart - WPF chart control


alt text

DevExpress charting tools are highly popular for data visualization that is concise and readable. XtraCharts suite is highly customization control library which is used for endless business scenarios. It is equally suitable for real-time charting or analysis of multi-dimensional data. DevExpress WPF chart control supports built-in animation effects, conditional appearance options and extended interactivity.

Pros Cons
Highly customization and flexible Comparatively slow
Good performance Do not manage rendering of web chart to the image
Numerous In-built supportive controls Used in WinForms control
Supports MVVM architecture  
Supports multiple data source  

Want to build scalable applications for your business? Hire React developer from us right now

4. Chart FX


This is a charting tool that supports .NET, HTML5, COM, WPF, Silverlight and SQL reporting services technologies. Chart FX is considered as one of the most powerful and versatile multi-platform tool for web and desktop software data visualization.

This provides software companies with advanced data visualization and analysis features with minimal integration effort. It enhances user interface and has ability to export the charts in various formats.

Pros Cons
Highly extensible Scalability and performance issue
Support multiple technology platforms  

5. Infragistics Chart


alt text

Infragistics chart is known to provide rich charts with less code. Infragistics Charts is Windows Forms Chart Control that renders a broad range of rich, high-fidelity chart types from familiar bar, line, area and pie to more complex financial, candle and radar charts. It helps building complex charts with series collections, chart area collections and chart layers collections.

Pros Cons
Easy-to-use Support only few chart like Data Chart, Doughnut Chart, Gantt Chart, Pie Chart
Highest quality visual appearance  
Handle real time feeds  

6. Microsoft Chart (.NET Chart)


alt text

Microsoft .Net Chart controls enable custom software development companies to create Windows Forms applications with simple, intuitive, and visually compelling charts for complex statistical or financial analysis. Window form chart control support Zooming and scrolling.

Pros Cons
Well documented Does not support Cursors, Zooming, and Scrolling, Printing feature in web application
Ready code templates  
Ability to view controls in action  
Supports all chart types  
Support for AJAX click events  

7. Nevron Chart


alt text

Nevron Chart is the most leading charting control for DOT NET software companies. It can easily be integrated with WinForms, ASP.NET, WPF and ASP.NET MVC projects. Nevron chart covers 2D and 3D charting types and is suitable for profession, business, scientific, real time monitoring and other types of applications.

It only provides great data visualization but is complemented with interactive features like data zooming, panning, scrolling and hit testing.

Pros Cons
Fast performance It does not support all charting types
Highly robust tool with great controls  
Better image quality  
It is offering a free charting solution for WinForms, WPF, and ASP.NET, covering basic charting functionality  

8. SciChart Chart


SciChart chart type that provides good performance, unlimited multiple X/Y axis, interactive zooming and panning and rich annotations API. It supports about 25 chart types and is infinitely extendable CustomRenderableSeries. It also supports WPF 3D Chart Controls including Real-time WPF 3D Surface Mesh Chart, WPF 3D Point-Cloud Chart, WPF 3D Bubble Chart, WPF 3D Scatter Chart, 3D Column Chart etc.

Pros Cons
  Some weird internal exceptions in SciChart
  SciChartSurface and SciChartLegend are separated control you can’t save them to same bitmap

9. Highcharts


alt text

Just like the .NET chart library, Highcharts is a JavaScript library based charting tool for software. It provides many pre-built graphs like spline, area, areaspline, column, bar, pie, scatter etc. Highcharts is a charting library written in pure JavaScript and it offers an easy way of adding interactive charts to web site or web application.

It has very simple API that is easy to learn and also light weighted. It allows user to use entire framework or selective modules as required. It is inspired by ReactJS, AngularJS, KnockoutJS and also supports two-way binding to get synchronized model and view.


Pros Cons
Light weight charting tool It supports only web application
Highcharts JS is compatible with older browsers as well like IE6, etc. Axis labels may overlap if long enough
Highly customizable No support for custom graphics and text in the generated charts.
Numerous chart types and the ability to combine them in one document  
Availability of charts in any of the following formats: pdf, png, jpg, svg.  

Planning to Hire .NET Software Developer? Your Search ends here

10. Fusion Chart


alt text

Fusion Charts is a paid charting JavaScript library and renders charts out of the box. It accepts input parameters and returns the chart as output. It is fairly easy to integrate this library with other libraries, frameworks and languages.Pros ConsSupports only web application Complex customizationCan be used to handle large scale projects

Pros Cons
Supports only web application Complex customization
Can be used to handle large scale projects  
 

So, these are the top .NET charting control tools one should be aware of. Hope this information helps. Want to create a customized dashboard for seamless data visualization? Get Power BI Consulting Services from iFour right away. With a decade of expertise, we provide you with the help you require.

Conclusion:


.Net Chart controls helps enhancing user interface and data visualization in most meaningful way. It is difficult to tag any charting tool as the best. Choice of charting tool by DOT NET software companies depends on project requirements, back-end technology, charting performance, cost and many other parameters. This list is an indicative list that a DOT NET software company can use to select.

Top 10 charting controls for DOT NET software development companies In the era of information, data visualization plays an important role in enhancing and making information systems useful to decision makers. This allow important data to be visualized properly so that important concepts, information and analytics are made handy to end users. Charting controls are important for DOT NET software development companies while developing software with data visualization. PIE Chart, LINE Chart, BAR Chart, BUBBLE Chart, PYRAMID chart etc are some of the charts that helps display information meaningfully with analysis. The charting controls allow user with additional features like sorting, filtering, grouping, searching, merging, splitting and exporting data in required format. In this article, we discuss about Top 10 chart controls that are very popular, feature rich and widely used by custom software companies in USA to build information rich softwares.   1. LightningChart Ultimate LightningChart Ultimate is the fastest, popular and widely used 2D and 3D measurement, financing, research and trading data visualization SDK for software development based on WinForms and WPF. LightningChart Ultimate is entirely GPU accelerated (Direct3D) and performance optimized data visualization control for presenting masses of data in 2D XY graph, 3D XYZ, polar, smith and 3D pie / donut views. Read More: Owasp Vulnerability: Missing Function Level Access Control Pros Cons Fastest rendering data visualization toolkit for .net framework Supports only Window and WPF Application Short loading delays   Better graphics quality   2. Telerik RadChart RadChart is an unrivalled and performance enhanced charting tool that helps developing next-generation software. It is highly feature rich with great data visualization capability and helps in better analysis of complex data. RadChat allows transformation of business data into animated charts and interactive UI. It is compatible with WPF. Pros Cons Supports multiple data sources Does not support scatter line chart It does not require additional assemblies Server side click events Better technical support   Good performance from speed perspective   3. DevExpress Chart - WPF chart control DevExpress charting tools are highly popular for data visualization that is concise and readable. XtraCharts suite is highly customization control library which is used for endless business scenarios. It is equally suitable for real-time charting or analysis of multi-dimensional data. DevExpress WPF chart control supports built-in animation effects, conditional appearance options and extended interactivity. Pros Cons Highly customization and flexible Comparatively slow Good performance Do not manage rendering of web chart to the image Numerous In-built supportive controls Used in WinForms control Supports MVVM architecture   Supports multiple data source   Want to build scalable applications for your business? Hire React developer from us right now Reach out us 4. Chart FX This is a charting tool that supports .NET, HTML5, COM, WPF, Silverlight and SQL reporting services technologies. Chart FX is considered as one of the most powerful and versatile multi-platform tool for web and desktop software data visualization. This provides software companies with advanced data visualization and analysis features with minimal integration effort. It enhances user interface and has ability to export the charts in various formats. Pros Cons Highly extensible Scalability and performance issue Support multiple technology platforms   5. Infragistics Chart Infragistics chart is known to provide rich charts with less code. Infragistics Charts is Windows Forms Chart Control that renders a broad range of rich, high-fidelity chart types from familiar bar, line, area and pie to more complex financial, candle and radar charts. It helps building complex charts with series collections, chart area collections and chart layers collections. Pros Cons Easy-to-use Support only few chart like Data Chart, Doughnut Chart, Gantt Chart, Pie Chart Highest quality visual appearance   Handle real time feeds   6. Microsoft Chart (.NET Chart) Microsoft .Net Chart controls enable custom software development companies to create Windows Forms applications with simple, intuitive, and visually compelling charts for complex statistical or financial analysis. Window form chart control support Zooming and scrolling. Pros Cons Well documented Does not support Cursors, Zooming, and Scrolling, Printing feature in web application Ready code templates   Ability to view controls in action   Supports all chart types   Support for AJAX click events   7. Nevron Chart Nevron Chart is the most leading charting control for DOT NET software companies. It can easily be integrated with WinForms, ASP.NET, WPF and ASP.NET MVC projects. Nevron chart covers 2D and 3D charting types and is suitable for profession, business, scientific, real time monitoring and other types of applications. It only provides great data visualization but is complemented with interactive features like data zooming, panning, scrolling and hit testing. Planning to hire Blockchain software developers? Reach out us Pros Cons Fast performance It does not support all charting types Highly robust tool with great controls   Better image quality   It is offering a free charting solution for WinForms, WPF, and ASP.NET, covering basic charting functionality   8. SciChart Chart SciChart chart type that provides good performance, unlimited multiple X/Y axis, interactive zooming and panning and rich annotations API. It supports about 25 chart types and is infinitely extendable CustomRenderableSeries. It also supports WPF 3D Chart Controls including Real-time WPF 3D Surface Mesh Chart, WPF 3D Point-Cloud Chart, WPF 3D Bubble Chart, WPF 3D Scatter Chart, 3D Column Chart etc. Pros Cons   Some weird internal exceptions in SciChart   SciChartSurface and SciChartLegend are separated control you can’t save them to same bitmap 9. Highcharts Just like the .NET chart library, Highcharts is a JavaScript library based charting tool for software. It provides many pre-built graphs like spline, area, areaspline, column, bar, pie, scatter etc. Highcharts is a charting library written in pure JavaScript and it offers an easy way of adding interactive charts to web site or web application. It has very simple API that is easy to learn and also light weighted. It allows user to use entire framework or selective modules as required. It is inspired by ReactJS, AngularJS, KnockoutJS and also supports two-way binding to get synchronized model and view.   Pros Cons Light weight charting tool It supports only web application Highcharts JS is compatible with older browsers as well like IE6, etc. Axis labels may overlap if long enough Highly customizable No support for custom graphics and text in the generated charts. Numerous chart types and the ability to combine them in one document   Availability of charts in any of the following formats: pdf, png, jpg, svg.   Planning to Hire .NET Software Developer? Your Search ends here See here 10. Fusion Chart Fusion Charts is a paid charting JavaScript library and renders charts out of the box. It accepts input parameters and returns the chart as output. It is fairly easy to integrate this library with other libraries, frameworks and languages.Pros ConsSupports only web application Complex customizationCan be used to handle large scale projects Pros Cons Supports only web application Complex customization Can be used to handle large scale projects     So, these are the top .NET charting control tools one should be aware of. Hope this information helps. Want to create a customized dashboard for seamless data visualization? Get Power BI Consulting Services from iFour right away. With a decade of expertise, we provide you with the help you require. Conclusion: .Net Chart controls helps enhancing user interface and data visualization in most meaningful way. It is difficult to tag any charting tool as the best. Choice of charting tool by DOT NET software companies depends on project requirements, back-end technology, charting performance, cost and many other parameters. This list is an indicative list that a DOT NET software company can use to select.

Build Your Agile Team

Enter your e-mail address Please enter valid e-mail

Categories

Ensure your sustainable growth with our team

Talk to our experts
Sustainable
Sustainable
 
Blog Our insights
10 Executive Dashboard Examples for Consultants and CEOs

There is a principle behind every business. “If you don’t keep track of essentials, you won’t get clear direction, eventually causing your company to stumble.” To manage this scenario,...

How Spatial Data Analysis Improves Healthcare

Do you know when geospatial analysis took traction in healthcare? It was when John Snow, a London-based physician, used it to analyze the spread of cholera, which ultimately proved...

4 Types of Power BI Dashboards: Analytical, Strategic, Operational, and Tactical

One interesting aspect you truly love about Power BI, as a CTO, is how it lets you step back and see the bigger picture of your business. Isn’t it? Without getting bogged down in minute...