×

iFour Logo

Introduction to Mini-profiler in C#

Kapil Panchal - February 21, 2021

Listening is fun too.

Straighten your back and cherish with coffee - PLAY !

  • play
  • pause
  • pause
Introduction to Mini-profiler in C#

For a developer a main challenge is to debug and optimize queries that are written for the request made to the server. It is impossible to get the exact time of the queries request for each page. Usually, developer considers count such as one, two, three and calculate the average but this is not a solution and as a developer, this is not we want. In developer's tool network tab provide information about the time per the request made for a page load but that is not enough for a developer to understand which query takes more time and which query requires optimization. This can be done by Mini-profiler.

Introduction to Mini-profiler

Mini-profiler is a profiling library that is used to monitor the performance of your ASP.NET application. It is used in production because of performance. Mini-profiler is developed by the team of stack exchange and it is available as a NuGet package and easy to use.

Mini-profiler can be used with high-performance micro ORM supporting SQL server, MySQL, SQLite etc. MVC Mini-profiler is an internal profiler that requires some modification to the pages being examined. To use the profiler developer, need to do two changes.

  • Prefer the master page which is used to call needed CSS and JavaScript file.
  • In application_Begin request and Application_End request, calls are required to start and stop profiler for that JQuery 1.6.1 is used.

The developer can call Mini-profiler within a given view or controller. The most useful feature of the Mini-profiler is its integration with the DB framework. Mini-profiler support for Entity Framework and LINQ to SQL because of .NET’s native Db-connection class. The number of queries and the amount of time they take is included in the step executed at that time. To detect common mistakes like N+1 anti-pattern profiler will detect multiple queries that differ only by argument value.

What does a mini-profiler profile?

Mini-profiler does not attach to every call, this could be invasive and could not focus on performance.

Mini-profiler provides the following feature:

  • An ADO.Net profiler is used to profiling calls on raw ADO.Net, SQL Server, Oracle, Linq to SQL, Entity framework which includes code first and EF core and a range of other data access scenarios.
  • Mini-profiler provides pragmatic step instrumentation that can be added to code to profile explicitly.

Where is Mini-profiler used?

Stack Overflow develops Mini-profiler. It is used in production and stack Exchange family sites use Mini-profiler.


Let's start with an example:


Step 1: Create an asp.net application

Start visual studio 2019

Open the start window and select to create a new project.

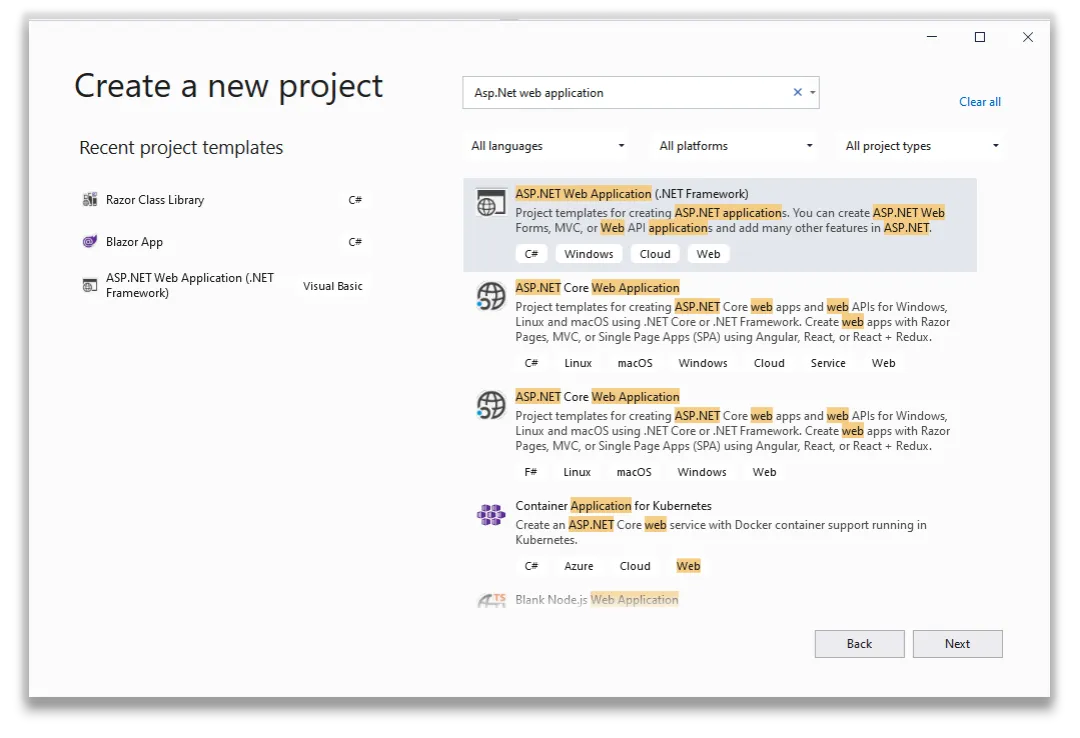
In Create new project page, search Asp.Net Web application template in the search box and then choose Next.

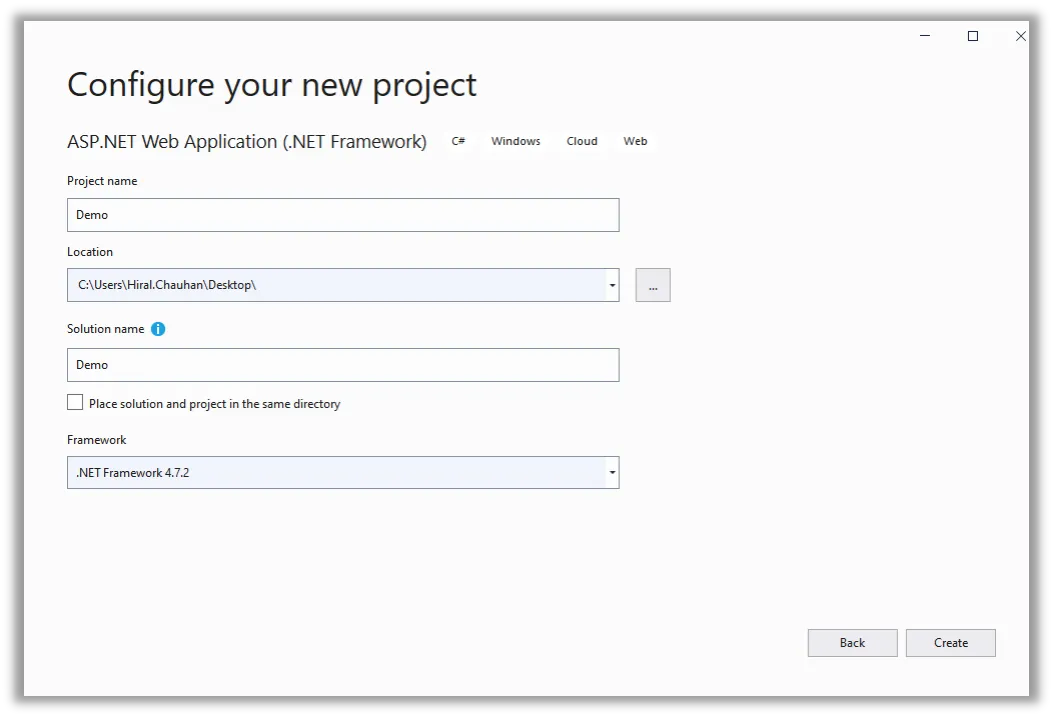
Enter DemoLibrary in the Project name box in configure your new project page. Then press Createbutton.
ai-Hiring-banner

Figure 1: Create an asp.net web application

ai-Hiring-banner

Figure 2: Configure your new project


Step 2: Install the Min-profiler .mvc5 NuGet package

Install the mini-profiler. mvc5 NuGet package from NuGet packet manager which is used to provide correct integration with ASP.NET MVC.

Right-click on the project and select the Manage NuGet package.

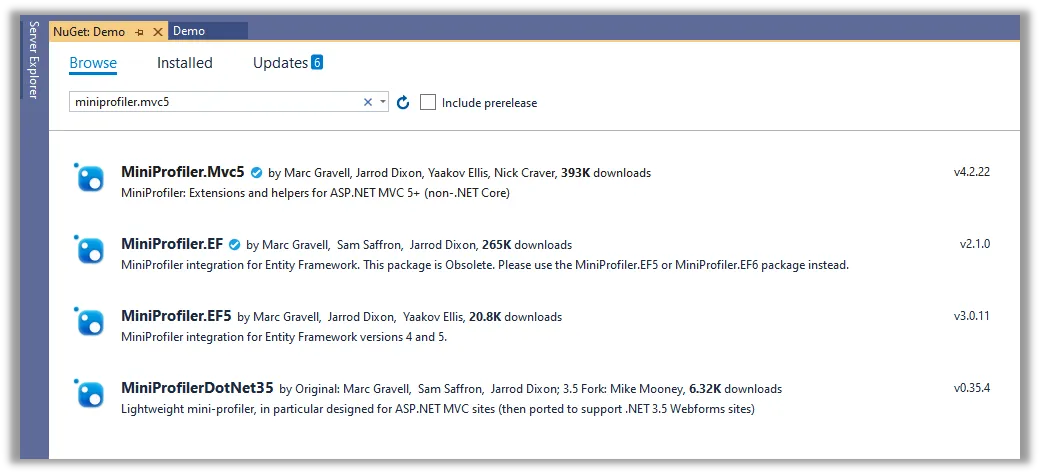
Search miniprofiler.mvc5 in NuGet page in the search box. SelectMiniProfiler.Mvc5 from the list, and then click on the Install button.

ai-Hiring-banner

Figure 3: Install Min-profiler.mvc5 package from NuGet package manager


Step 3: Add configuration for Mini-profiler

Add Configuration in Global.asax file in application_start method.

Add following block of code inside application_start method on Global.asax file.

To use MiniProfiler.Configure() method you have to add using StackExchange.Profiling; library in Global.asax file.

 
	MiniProfiler.Configure(new MiniProfilerOptions());

Add Application_beginrequest() and Application_endrequest() method in Global.asax file

 
	protected void Application_beginrequest()
	{
	MiniProfiler profiler = null;
	if (Request.IsLocal)
	{
	profiler = MiniProfiler.StartNew();
	}
	}
	protected void Application_endrequest()
	{
	MiniProfiler.Current?.Stop();
	}
Step 4: Add Script in the view page

The easiest way of adding script is to add a script in shared/_Layout.cshtml master view.Add using StackExchange.Profiling; namespace to use @MiniProfiler.Current.RenderIncludes() method in view page.

Add following one-line code into _Layout.cs page:


Step 5: Add Configuration for route request

Let's run the project and nothing happens because Miniprofiler dependent on JavaScript and .js request therefore .net request is not executed.

Add following block of code in configuration file

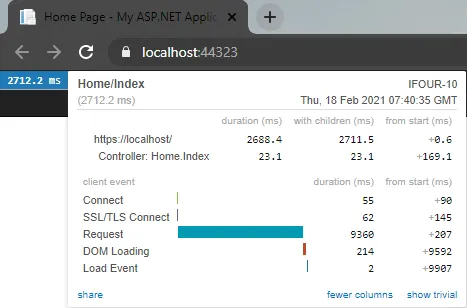
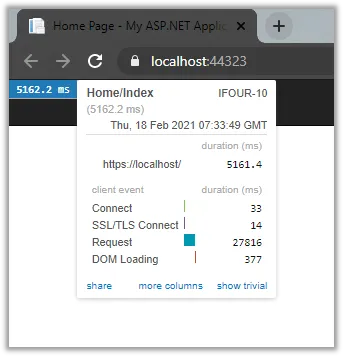
Now run your project and you will get MiniProfiler UI on the left corner of the application and by click, you will get execution time information.

ai-Hiring-banner

Figure 4: Run project

Step 6: To track MVC controller

Current view display overall execution which is not very useful. In the MVC application by adding a new filter into the pipeline can bit more information on the execution time of each action.

Planning to Hire C# Web Development Company ? Your Search ends here

Add the following Line into the FilterConfig file

 
	filters.Add(new ProfilingActionFilter());

And add using StackExchange.Profiling.Mvc; namespace

Now, run your application and you will find the execution time of the controller.

ai-Hiring-banner

Figure 5: Run Application

Step 7: Start using it.

Here is some sample code for the try.

Add the following block of code in the Index method of the Home controller

 
	public ActionResult Index()
	{
	var profiler = MiniProfiler.Current;
	using (profiler.Step("set page title"))
	{
	ViewBag.title = "home page";
	}
	using (profiler.Step("doing complex stuff"))
	{
	using (profiler.Step("step a"))
	{
	// simulate fetching a url
	using (profiler.CustomTiming("http", "get http://google.com"))
	{
	Thread.Sleep(10);
	}
	}
	using (profiler.Step("step b"))
	{
	// simulate fetching a url
	using (profiler.CustomTiming("http", "get http://stackoverflow.com"))
	{
	Thread.Sleep(20);
	}
	using (profiler.CustomTiming("redis", "set \"mykey\" 10"))
	{
	Thread.Sleep(5);
	}
	}
	}
	// now something that loops
	for (int i = 0; i < 15; i++)
	{
	using (profiler.CustomTiming("redis", "set \"mykey\" 10"))
	{
	Thread.Sleep(i);
	}
	}
	return View();
	}

Run your application

ai-Hiring-banner

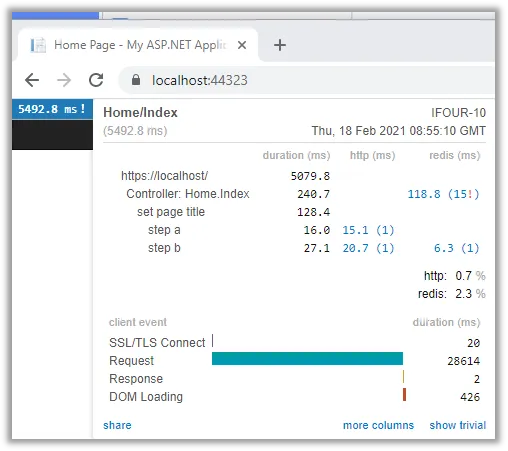
Figure 6: Run Application

Using MiniProfiler you can notice interesting information that the code is calling the same 15 times and how much time is spent in a different operation like (HTTP, Redis).

Conclusion

In this blog, we have discussed how to use the Mini-Profiler in ASP.NET MVC which is used to monitor the performance of your application and we have also discussed examples that display the execution time of the application.

Introduction to Mini-profiler in C# For a developer a main challenge is to debug and optimize queries that are written for the request made to the server. It is impossible to get the exact time of the queries request for each page. Usually, developer considers count such as one, two, three and calculate the average but this is not a solution and as a developer, this is not we want. In developer's tool network tab provide information about the time per the request made for a page load but that is not enough for a developer to understand which query takes more time and which query requires optimization. This can be done by Mini-profiler. Introduction to Mini-profiler Mini-profiler is a profiling library that is used to monitor the performance of your ASP.NET application. It is used in production because of performance. Mini-profiler is developed by the team of stack exchange and it is available as a NuGet package and easy to use. Mini-profiler can be used with high-performance micro ORM supporting SQL server, MySQL, SQLite etc. MVC Mini-profiler is an internal profiler that requires some modification to the pages being examined. To use the profiler developer, need to do two changes. Prefer the master page which is used to call needed CSS and JavaScript file. In application_Begin request and Application_End request, calls are required to start and stop profiler for that JQuery 1.6.1 is used. The developer can call Mini-profiler within a given view or controller. The most useful feature of the Mini-profiler is its integration with the DB framework. Mini-profiler support for Entity Framework and LINQ to SQL because of .NET’s native Db-connection class. The number of queries and the amount of time they take is included in the step executed at that time. To detect common mistakes like N+1 anti-pattern profiler will detect multiple queries that differ only by argument value. What does a mini-profiler profile? Mini-profiler does not attach to every call, this could be invasive and could not focus on performance. Mini-profiler provides the following feature: An ADO.Net profiler is used to profiling calls on raw ADO.Net, SQL Server, Oracle, Linq to SQL, Entity framework which includes code first and EF core and a range of other data access scenarios. Mini-profiler provides pragmatic step instrumentation that can be added to code to profile explicitly. Where is Mini-profiler used? Stack Overflow develops Mini-profiler. It is used in production and stack Exchange family sites use Mini-profiler.   Let's start with an example: Read More: Test Driven Development In Mvc Step 1: Create an asp.net application Start visual studio 2019 Open the start window and select to create a new project. In Create new project page, search Asp.Net Web application template in the search box and then choose Next. Enter DemoLibrary in the Project name box in configure your new project page. Then press Createbutton. Figure 1: Create an asp.net web application Figure 2: Configure your new project Step 2: Install the Min-profiler .mvc5 NuGet package Install the mini-profiler. mvc5 NuGet package from NuGet packet manager which is used to provide correct integration with ASP.NET MVC. Right-click on the project and select the Manage NuGet package. Search miniprofiler.mvc5 in NuGet page in the search box. SelectMiniProfiler.Mvc5 from the list, and then click on the Install button. Figure 3: Install Min-profiler.mvc5 package from NuGet package manager Step 3: Add configuration for Mini-profiler Add Configuration in Global.asax file in application_start method. Add following block of code inside application_start method on Global.asax file. To use MiniProfiler.Configure() method you have to add using StackExchange.Profiling; library in Global.asax file.   MiniProfiler.Configure(new MiniProfilerOptions()); Add Application_beginrequest() and Application_endrequest() method in Global.asax file   protected void Application_beginrequest() { MiniProfiler profiler = null; if (Request.IsLocal) { profiler = MiniProfiler.StartNew(); } } protected void Application_endrequest() { MiniProfiler.Current?.Stop(); } Step 4: Add Script in the view page The easiest way of adding script is to add a script in shared/_Layout.cshtml master view.Add using StackExchange.Profiling; namespace to use @MiniProfiler.Current.RenderIncludes() method in view page. Add following one-line code into _Layout.cs page:   Step 5: Add Configuration for route request Let's run the project and nothing happens because Miniprofiler dependent on JavaScript and .js request therefore .net request is not executed. Add following block of code in configuration file Now run your project and you will get MiniProfiler UI on the left corner of the application and by click, you will get execution time information. Figure 4: Run project Step 6: To track MVC controller Current view display overall execution which is not very useful. In the MVC application by adding a new filter into the pipeline can bit more information on the execution time of each action. Planning to Hire C# Web Development Company ? Your Search ends here See here Add the following Line into the FilterConfig file   filters.Add(new ProfilingActionFilter()); And add using StackExchange.Profiling.Mvc; namespace Now, run your application and you will find the execution time of the controller. Figure 5: Run Application Step 7: Start using it. Here is some sample code for the try. Add the following block of code in the Index method of the Home controller   public ActionResult Index() { var profiler = MiniProfiler.Current; using (profiler.Step("set page title")) { ViewBag.title = "home page"; } using (profiler.Step("doing complex stuff")) { using (profiler.Step("step a")) { // simulate fetching a url using (profiler.CustomTiming("http", "get http://google.com")) { Thread.Sleep(10); } } using (profiler.Step("step b")) { // simulate fetching a url using (profiler.CustomTiming("http", "get http://stackoverflow.com")) { Thread.Sleep(20); } using (profiler.CustomTiming("redis", "set \"mykey\" 10")) { Thread.Sleep(5); } } } // now something that loops for (int i = 0; i < 15; i++) { using (profiler.CustomTiming("redis", "set \"mykey\" 10")) { Thread.Sleep(i); } } return View(); } Run your application Figure 6: Run Application Using MiniProfiler you can notice interesting information that the code is calling the same 15 times and how much time is spent in a different operation like (HTTP, Redis). Conclusion In this blog, we have discussed how to use the Mini-Profiler in ASP.NET MVC which is used to monitor the performance of your application and we have also discussed examples that display the execution time of the application.
Kapil Panchal

Kapil Panchal

A passionate Technical writer and an SEO freak working as a Content Development Manager at iFour Technolab, USA. With extensive experience in IT, Services, and Product sectors, I relish writing about technology and love sharing exceptional insights on various platforms. I believe in constant learning and am passionate about being better every day.

Build Your Agile Team

Enter your e-mail address Please enter valid e-mail

Categories

Ensure your sustainable growth with our team

Talk to our experts
Sustainable
Sustainable
 
Blog Our insights
13 Ways Power Apps Simplifies eDiscovery

E-Discovery is a crucial process for legal research enabling lawyers to find the digital evidence they need. It involves finding, collecting, and filtering e-data related to their...

Top Data Analytics Trends You Can't Ignore

Can you believe that 147 zettabytes of data have already been created in 2024, and guess what? It is anticipated to be 180 zettabytes by 2025 (according to Statista). Now just think...

Why Use Power Apps for Case Management – 11 Reasons

It’s amazing to witness that legal consultants who once clung to print documents have now embraced modern technologies for their legal work. In fact, a recent survey revealed that...