How to Do Forecasting in Power BI (Steps & Accuracy Metrics)
Remember our last guide - Power BI forecasting? It revealed things that truly blocks accuracy, both structural and situational. Now it's time to take the next step. Knowing Power...
Listening is fun too.
Straighten your back and cherish with coffee - PLAY !

Ever thought about a tool that bypasses Excel's limitations and simplifies complex data analysis? Microsoft Power BI offers a solution to this challenge. It is one of the best data analytics platforms with exceptional capabilities that aid in simpler data visualization for various data sources.
So, if you are using Excel for your sophisticated reports and growing business data then you should consider migration from Excel to Power BI.
Microsoft Power BI fulfils all your data management needs and lets you produce interactive visuals. It allows you to easily integrate and organize data from many sources. This helps with better decision-making and increases the efficiency of your analytical activities.
However, it becomes essential to consider specific steps before switching to new analytics technology so that you can know what its rewards and drawbacks will be. In today’s blog, we will discover the top 7 reasons to consider for Power BI adoption from Excel.
When you feel that Excel is less effective at managing Big data or large datasets, consider migrating to Power BI. Microsoft Power BI is the best solution to eliminate spending time on manual data management and updating. It has advanced features that help you create complex visualisations, predict analytics with ML, and provide fruitful collaboration.
With its customized dashboards and real-time insights, C-level officials can improve decision-making in their business.
Let’s discuss some scenarios to understand when to migrate from Excel to Power BI.
So, in such situations, you can surely think about moving from Excel to Power BI. Need help with Power BI migration? iFour is at your service. Contact us to avail our Power BI consulting services.
Let’s look at some significant reasons why businesses should decide to migrate.
Take a look at these prime Power BI use cases we've crafted for our industry CTOs. These BI examples helped them simplify their operational decisions!
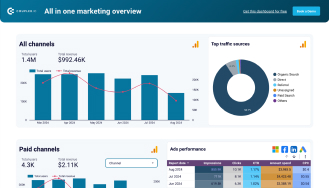
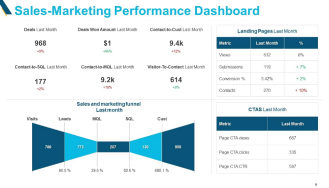
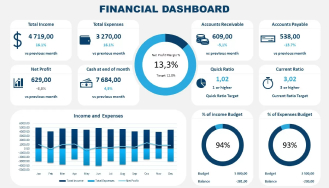
Here are some top reasons to migrate from Excel to Power BI technology.
Power BI can handle big data effortlessly which is one of the key reasons CTOs migrate from Tableau to Power BI or from any other platform. So, if you too have big data to manage and require no data loading headaches then Power BI migration is what you need. Power BI can handle greater amounts of data without slowing down, allowing you to work with huge datasets without issue. Power BI allows you to view, analyze, and visualize large datasets that can’t be opened in Microsoft Excel. Moreover, it uses powerful compression algorithms to import and cache the data within the .PBIX file. So, with Power BI, you don’t have to cut down the sizes of large data sets instead you can enjoy all files together and access them through drill-downs.
Power BI has amazing tools for bringing your data to life with interactive charts, maps, and other diagrams, making your reports more engaging and insightful. Power BI integrates with Bing Maps to provide default map coordinates allowing you to create maps using your data. With Power BI, you can create multiple charts, for instance, Area charts, Bar charts, Line charts, Pie charts, Column charts, and Combo charts to display your data more appealingly.
Importing data from various sources such as databases, web platforms, and other data repositories can significantly enhance the efficiency and accuracy of the data collection process. Power BI connects to several data sources which include, files, template apps, databases, cloud-based services, and web platforms. This way, you can easily gather data from different sources and handle various sorts of data in one place.
The automatic refresh in Power BI refreshes the information in an activity report as soon as the data source changes. This allows you to see every change in real time. And so, you can manage critical events and readjust your business strategies accordingly. Overall, Power BI keeps your reports updated by automatically updating them whenever new data arrives.
This visualization tool helps to share information with others both internally and externally of your business. Internal sharing of reports is possible via link sharing and collaborating in the workspace. While external sharing can be done by exporting data online or by granting access to users. With Power BI, you and your team can work on reports and dashboards in real-time, making collaboration easier and keeping everyone on the same page.
With Power BI you can add Row Level Security features which ensures that employees in organizations can only see data relevant to their local geography. Power BI allows you to limit access to who can see what data, keeping your information safe and assisting you in following industrial laws or regulations. So, import Excel into Power BI to remain stress-free.
You can view your Power BI reports from your phone or tablet, allowing you to check your data no matter where you are, making it easy to access especially when you are traveling. Mobile-optimized reports are displayed with special icons while web browser reports are displayed in a standard view. Moreover, you can automatically generate mobile-optimized layouts for a report page using the auto-create mobile layout component.
Moving from Excel data visualization to Power BI migration presents multiple advantages, making it a better choice. Power BI enhances user engagement by integrating interactivity into slicers and filters, enabling hands-on data examination. Moreover, it helps to Increase cooperation by readily distributing reports throughout your organization, allowing efficient team collaboration. Organizations that migrate from Excel reporting to Power BI can benefit from data analysis, decision-making, and operational efficiency.
Given below are some of the successful Power BI case studies of Excel to Power BI migration. By reviewing these examples, you will learn how other businesses have effectively adopted Power BI to improve their data visualization and reporting processes, and make data-driven decisions more efficiently.
These case studies demonstrate the tangible outcomes of enhanced data integration, real-time analytics, and improved decision-making capabilities that Power BI offers.
1. Sales Insights Data Analysis Project - AtliQ Hardware
The hardware manufacturer company struggled to display its sales trends. They adopted Power BI for sales data analysis practices. This helped to look at a company's sales data and calculate profit by product, sales, and other relevant elements that may affect the company's performance. The real-time data insights helped sales directors to make informed decisions.
2. Marketing Campaign Result Dashboard - Maven Marketing
The Power BI dashboard was created in response to the Maven marketing challenge. The dashboard provides a centralized view to optimize the performance of marketing campaigns. Now this can help businesses make data-driven decisions ultimately resulting in improving their marketing ROI.
3. Global Health Expenditure Analysis
Here is one of the most useful Power BI project ideas - Global Health Expenditure Analysis. This project helps to analyze global health expenditure data to understand spending in the healthcare sector across counties and regions. With this dashboard, we can get insights into health expenditure trends, discover their relationship, and identify key patterns.
The Power BI dashboard helps to determine airline datasets like passengers, flight departures, flight status, pilot details, count of passengers in the country, age group of passengers, and many more details. This in-depth airport data analysis could help airport management make quick data-driven decisions.
So, these are some real-life Power BI projects that describe the true potential of Power BI and help industries to unlock the full potential of their data and increase business value.
Excel to Power BI transition is a strategic move for C-level executives. This helps you in various ways and overcomes several challenges that you face with Excel. Power BI offers real-time analytics, enhanced data visualization, and improved decision-making capabilities that Excel simply can't match.
This transition from Excel to Power BI helps you with efficient data handling and reporting, leading to better operational efficiency and agility. Require assistance to migrate from Excel to Power BI? Worry not, we at iFour are specialized in Power BI Consulting services and migration and help you with successful migration. Reach us out and let us know your transition requirements. Ready to import Excel into Power BI? Get in touch now!
(Turning insights into various data visualizations)
Power BI will be hard to replace Microsoft Excel because both technologies offer different functions. Apart from data analysis, Excel can also be used to manage lists and budgets. Power BI is a robust tool for analyzing large amounts of data and creating sophisticated reports, but it doesn't do everything Excel can. Instead of replacing Excel, combining Power BI can assist in handling more complex data while Excel deals with routine tasks. Despite Power BI’s capabilities for heavy-duty data processing, Excel remains a valuable tool for everyday tasks and complements Power BI effectively.
For individuals and small teams in need of basic data analysis and visualization tools, Excel can be a good choice. But if you need to work with huge datasets, produce interactive data visualizations, and spread insights throughout your company, Power BI is the best option. Companies that need strong reporting, dashboards, and collaboration tools to properly make data-driven choices will find Power BI very helpful.
When your insights are locked inside Power BI, and you require a quick data for manipulation, then exporting Power BI data to Excel would help.
Switching from Excel to Power BI empowers businesses to experience the true potential of their business data. The key reasons to switch from Excel to Power BI include rich visualization possibilities, handling of data sets with ease, automation, and collaboration support. Also, compared to Excel, Power BI offers greater choices for dynamic and interactive dashboards. Power BI provides easy interaction with a huge range of data, making it possible for you to connect to databases, cloud services, and much more.
The first reason for uploading Excel reports to Power BI is when working with huge datasets, Power BI won't slow you down or have any constraints because it can handle greater volumes of data more efficiently than Excel. Another reason is Power BI provides greater interactive abilities and visualization options that can enhance the clarity and insight of your reports. In short, Power BI's capabilities improve your Excel reports and extract more value from your data.
With Power BI you can maintain huge datasets at a time with any process, however, Excel is also helpful but it is considered for basic usage. Power BI comprises advanced features for enhanced visuals and an interactive dashboard and even lets you collaborate in team security. Therefore, Power BI is the best option if you need to produce dynamic, polished reports or when you are working with large amounts of data.
You should consider the following factors while migrating from Excel to Power BI.
This eBook shows you how.

Remember our last guide - Power BI forecasting? It revealed things that truly blocks accuracy, both structural and situational. Now it's time to take the next step. Knowing Power...

It's amazing to see how Data teams today are racing ahead - moving from traditional warehouses to cloud-native platforms, lakehouses, and real-time architectures. But in this rush,...

Think about the last time CTOs spent most of their time fixing old systems. Updates were slow, servers were expensive, and adding new features took time. Now, things have changed....